
Buckinghamshire’s average house price now stands at £406,332, having fallen 1.0 per cent over the last year, the weakest rate of any of the 27 county council areas and markedly below the rises of 1.7 and 3.5 per cent recorded across the south east region and the UK as a whole respectively.
While the 2.6 per cent rise recorded in Chiltern over the last year was the strongest growth recorded among Buckinghamshire’s districts, it ranked only 212th among the 380 local authority districts in Great Britain. The 3.9 per cent fall in Aylesbury was the 12th weakest annual growth of any of the 380 local authorities in Great Britain.
Table 1: Mean house prices, September 2018

Source: Land Registry, 2018
Over the last year the average price of flats in Buckinghamshire has fallen by 3.4 per cent (£8,039), with falls recorded in all four districts. The average prices of semi-detached and terraced properties have also fallen over the last year by 0.6 per cent (£2,468) and 1.2 per cent (£3,769) respectively. Despite falling compared to August, detached houses have continued to see year on year price rises, up 0.4 per cent (£2,634) across Buckinghamshire and rising in all districts except Aylesbury Vale, where prices fell 2.8 per cent (£15,794) over the last year.
Table 2: Mean house prices & annual change by property type, September 2018
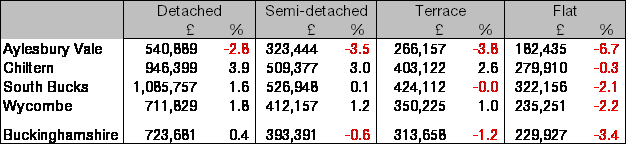
Source: Land Registry, 2018
There were 597 house sales in Buckinghamshire in July, taking the total for the last year to 7,931, the lowest for any 12 month period since the end of August 2013, 22.4 per cent below the post-recession peak of 10,220 reached in the year ending March 2016, and 38.9 per cent below the all-time high of 12,987 sales recorded in the year ending June 2000. By district, the fall in sales over the last year ranged from 17.4 per cent in Chiltern to 9.0 per cent in Aylesbury Vale.
Chart 1: House sales over time (year to July 2007 = 100)

Source: HM Land Registry, 2018
Chart 2: Mean house prices over time (September each year, 2008 = 100)
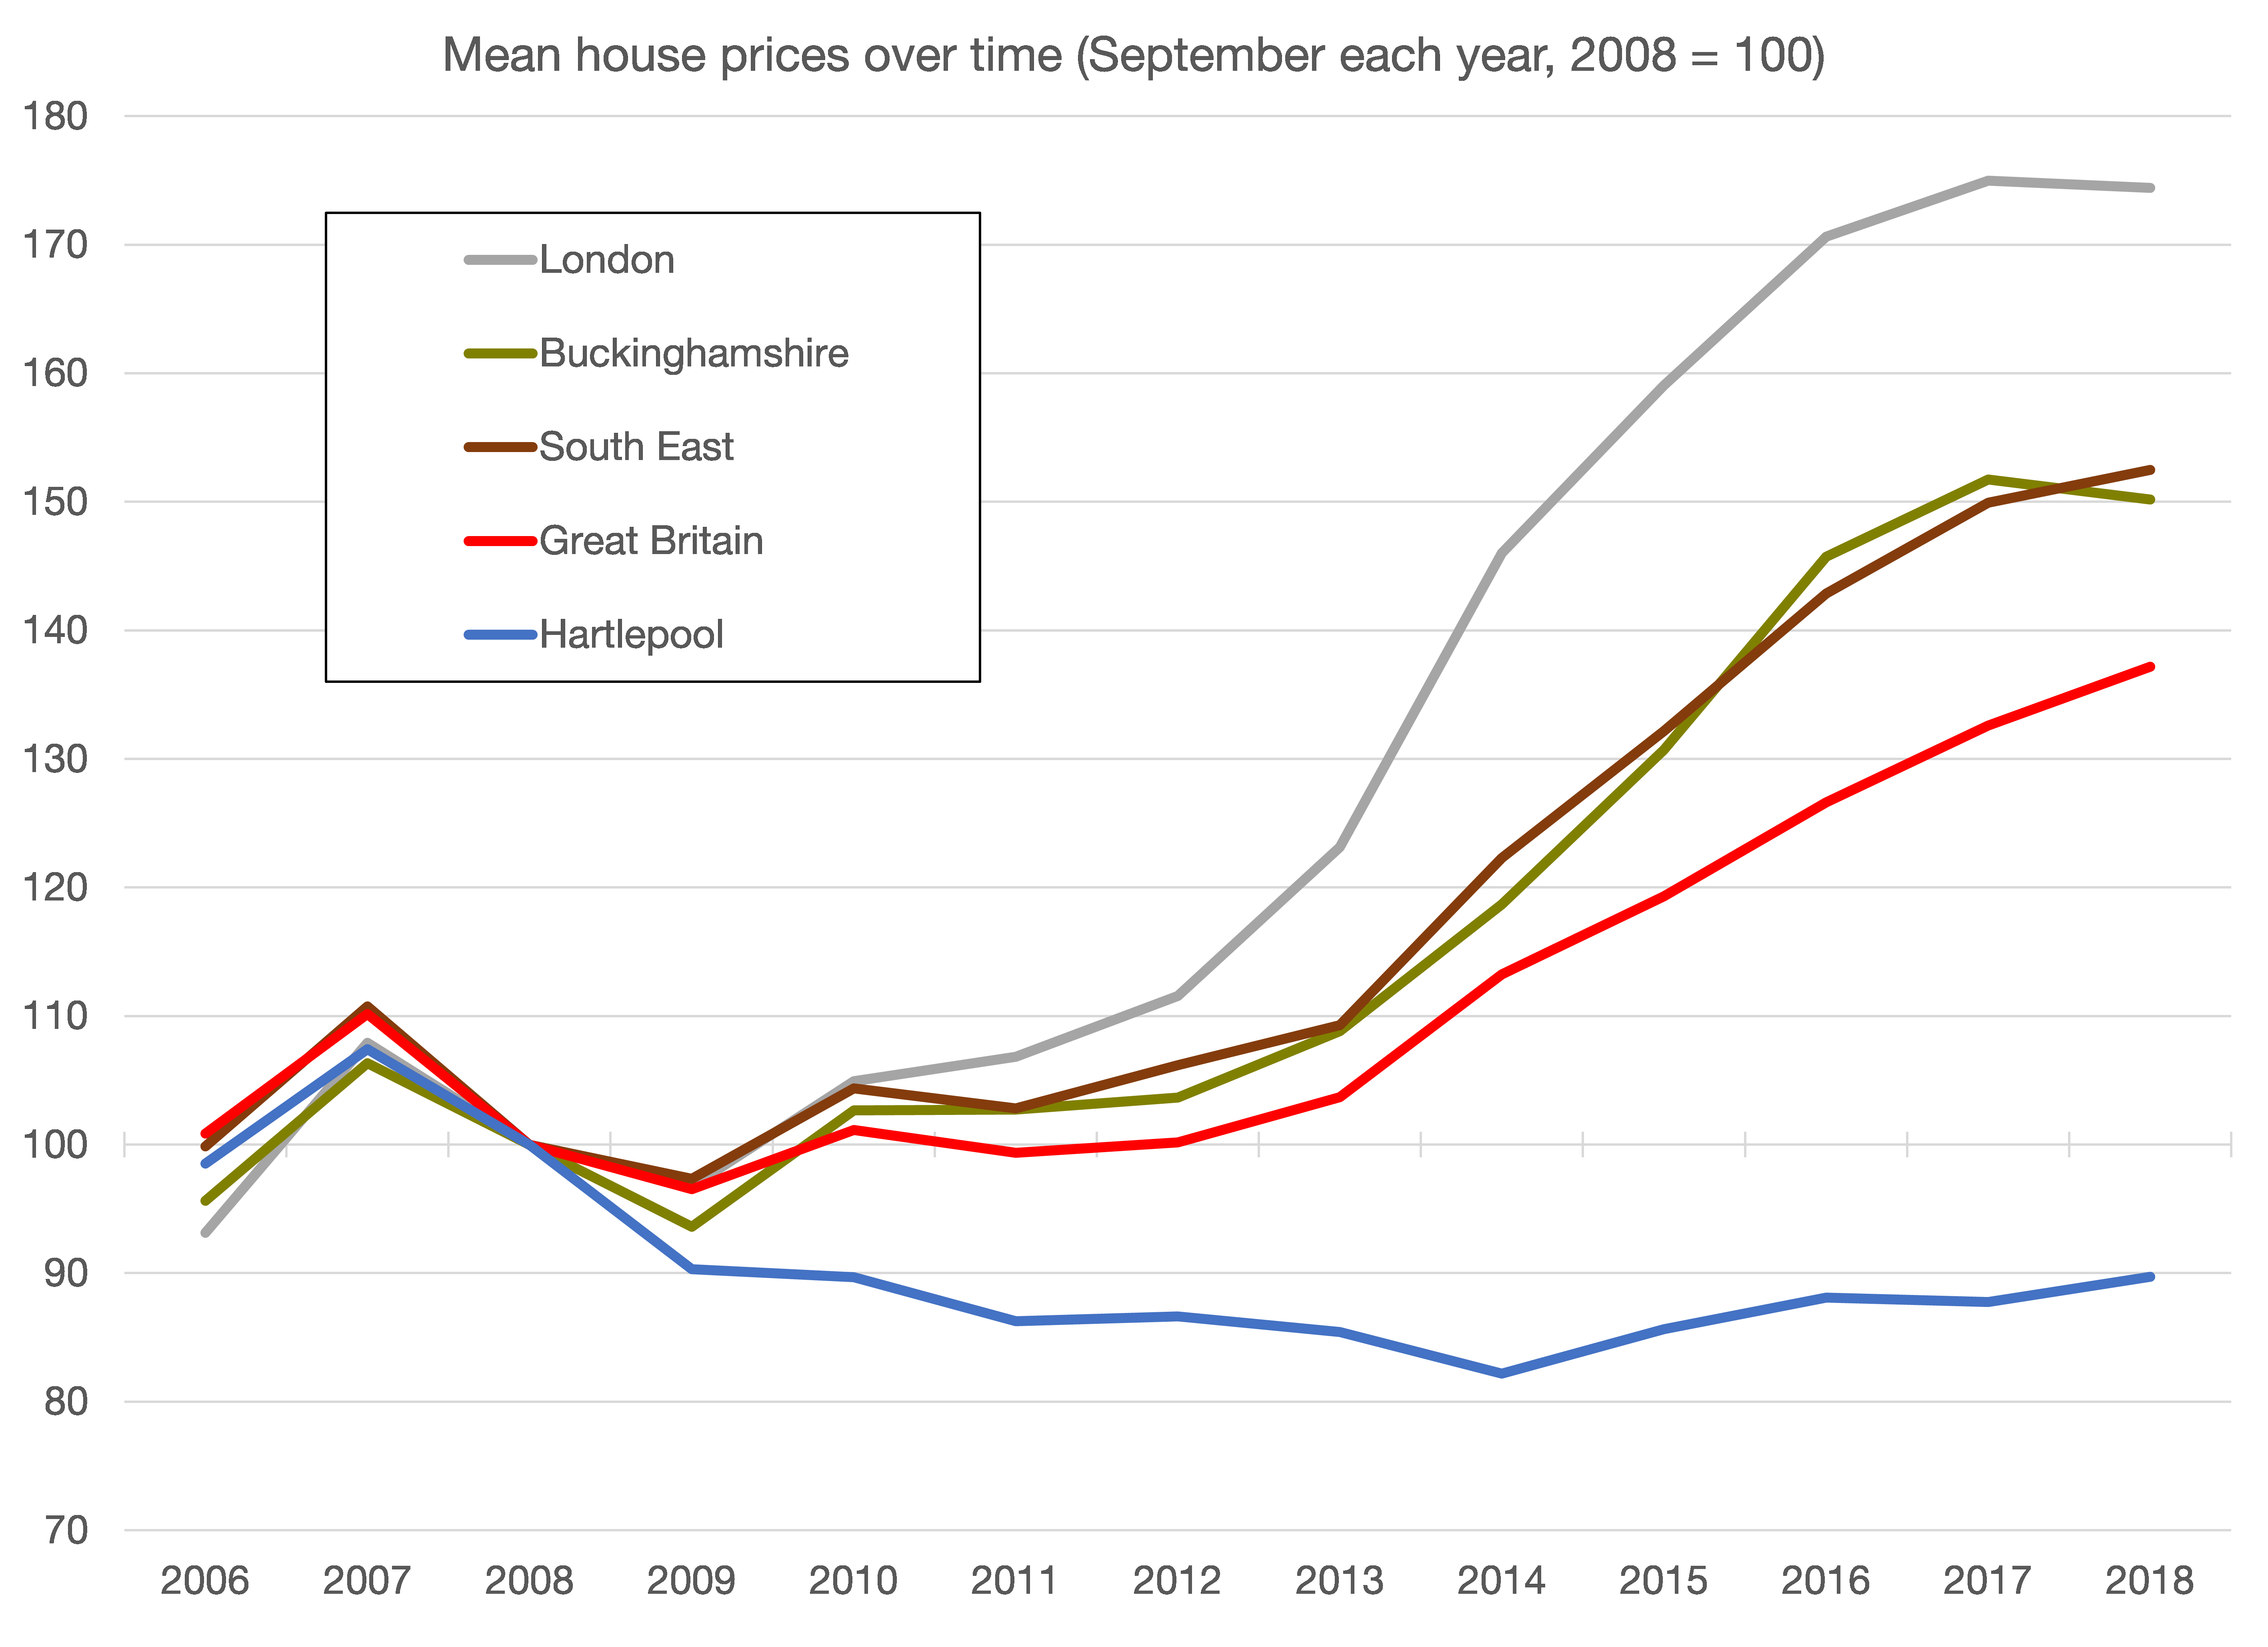
Source: HM Land Registry, 2018