Buckinghamshire’s population is projected to increase by 40,224, or 7.5 per cent, between 2016 and 2026, reaching 573,280.
Buckinghamshire’s rate of growth will be above the national and regional rates, ranking 7th highest among both the 27 county council areas and the 38 Local Enterprise Partnerships (LEPs). Aylesbury Vale is projected to account for 68.1 per cent of Buckinghamshire’s growth to 2026, and 67.1 per cent from 2026 to 2036.
Natural change of 15,800 will account for 39.3 per cent of Buckinghamshire’s growth, with 60,900 births compared to only 45,100 deaths. Migration will account for the remaining 24,400, with people moving in from other parts of England adding 22,600 new residents, with net inflows from the rest of the world contributing 4,300 additional residents. Buckinghamshire will see a net loss of 3,000 residents to Scotland, Wales and Northern Ireland.
Table 1: Projected population change to 2026 and 2036
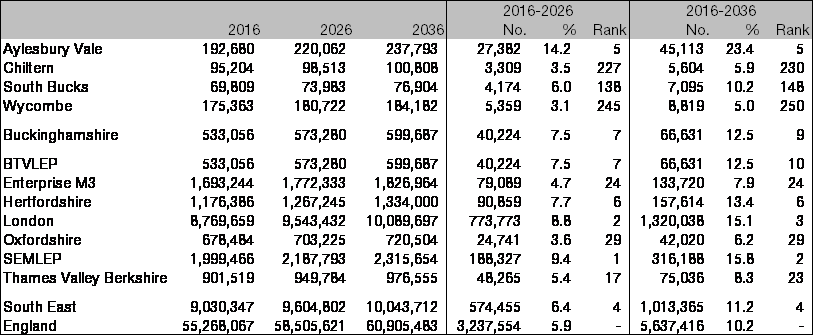
Source: ONS, SNPP, 2018
Although Buckinghamshire’s population will grow by 40,224, only 11,003 (or 27.4 per cent) will be of working age. While the number of working age residents is projected to rise by 4.7 per cent between 2014 and 2026, the numbers of young (0-15) and older (65+) residents are projected to rise by 7.7 and 21.3 per cent respectively. Working age residents made up 61.2 per cent of Buckinghamshire’s population in 2016, this is projected to fall to 58.8 per cent in 2026, 56.7 per cent in 2036 and 56.0 per cent in 2041.
Aylesbury Vale’s projected population increase of 27,382 by 2026 represents a 14.2 per cent increase, the 5th highest of all 326 local authority districts in England. This includes an increase of 9.4 per cent (11,360) in working age residents, more than four times the national rate of growth to rank 11th. South Bucks is expected to see an increase in working age residents of 522 (1.3 per cent), with Chiltern (356, -0.6 per cent) and Wycombe (523, -0.5 per cent) both projected to see falls to 2026.
All LEPs, except Cumbria, are projected to see population growth to 2026, however only 25 of the 38 are projected to see an increase in working age population. The working age population will rise more slowly than the population as a whole in all 38 LEPs and in all local authority districts in England except the London Borough of Barking and Dagenham.
London will account for 48.9 per cent of England’s growth in working age population but only 23.9 per cent of total population growth to 2026.
Table 2: Projected population by broad age group, 2016 to 2026

Source: ONS, SNPP, 2018
By 10 year cohort, Buckinghamshire will see the largest increase in population among residents aged 10-19 (11,078), ahead of those in their 60s (9,871), 70s (9,295), and 80s (7,368). The number of residents is expected to rise in all 10 year cohorts with the exception of residents in their 20s where the population is projected to fall by 4,568 (8.3 per cent). By 2026, only 8.8 per cent of Buckinghamshire residents will be in their 20s, down from 10.3 per cent in 2016, the lowest share of any LEP for both years.
By 2026, despite being above the national level, Buckinghamshire will have only the 26th highest share of residents aged 65 and over among the 38 LEPs, at 20.7 per cent, well behind the 27.5 per cent recorded in Dorset, although Buckinghamshire will see the strongest growth rate for residents aged 90 or over. Buckinghamshire will continue to have more residents in their 40s than any other ten year cohort, despite their share of the total population falling from 14.6 per cent in 2016 to 13.7 per cent in 2026.
Chart 1: Buckinghamshire’s comparative demography over time (England = 100)

Source: ONS, SNPP, 2018
Chart 2: Buckinghamshire’s population pyramid, 2016

Source: ONS, SNPP, 2018
Chart 3: Buckinghamshire’s population pyramid, 2026

Source: ONS, SNPP, 2018
Table 3: Projected population by broad age group, 2016 to 2026

Source: ONS, SNPP, 2018