There were 14,690 rateable properties in Buckinghamshire in April 2016, providing 4,218,000m2 of business floorspace with a rateable value of £432.1m.
There were 14,690 rateable properties in Buckinghamshire in April 2016, providing 4,218,000m2 of business floorspace with a rateable value of £432.1m. Over the last year, total business floorspace in Buckinghamshire fell by 3,000m2 (0.1 per cent), while the number of rateable properties rose by ten (0.1 per cent) and rateable value rose by £1.0m (0.2 per cent). At £102.40 Buckinghamshire has the 12th highest rateable value per m2 among Local Enterprise Partnerships (LEPs), rising to £165.50 for retail to rank 7th.
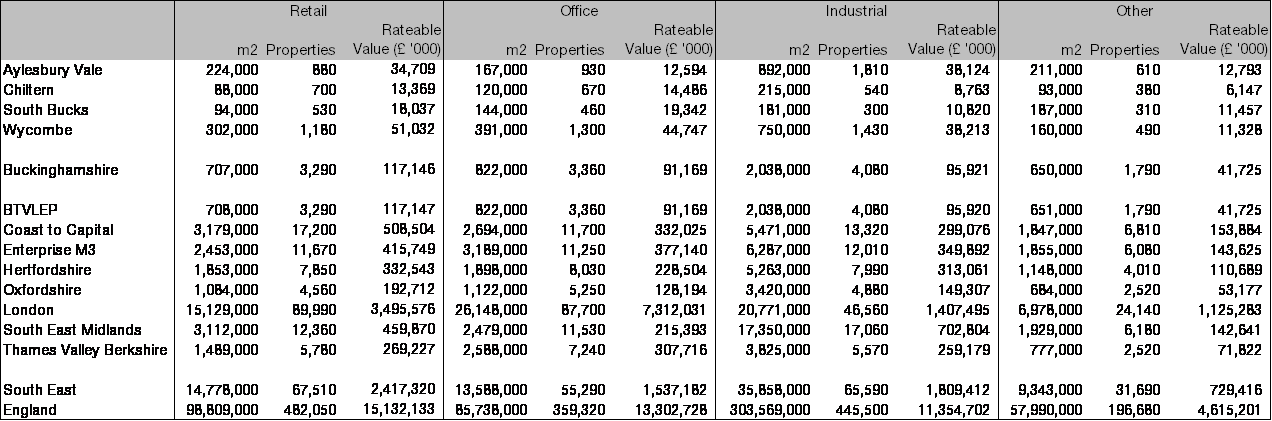
Table 1: Business floorspace and rateable value, 2015/16

Source: Valuation Office Agency, 2016
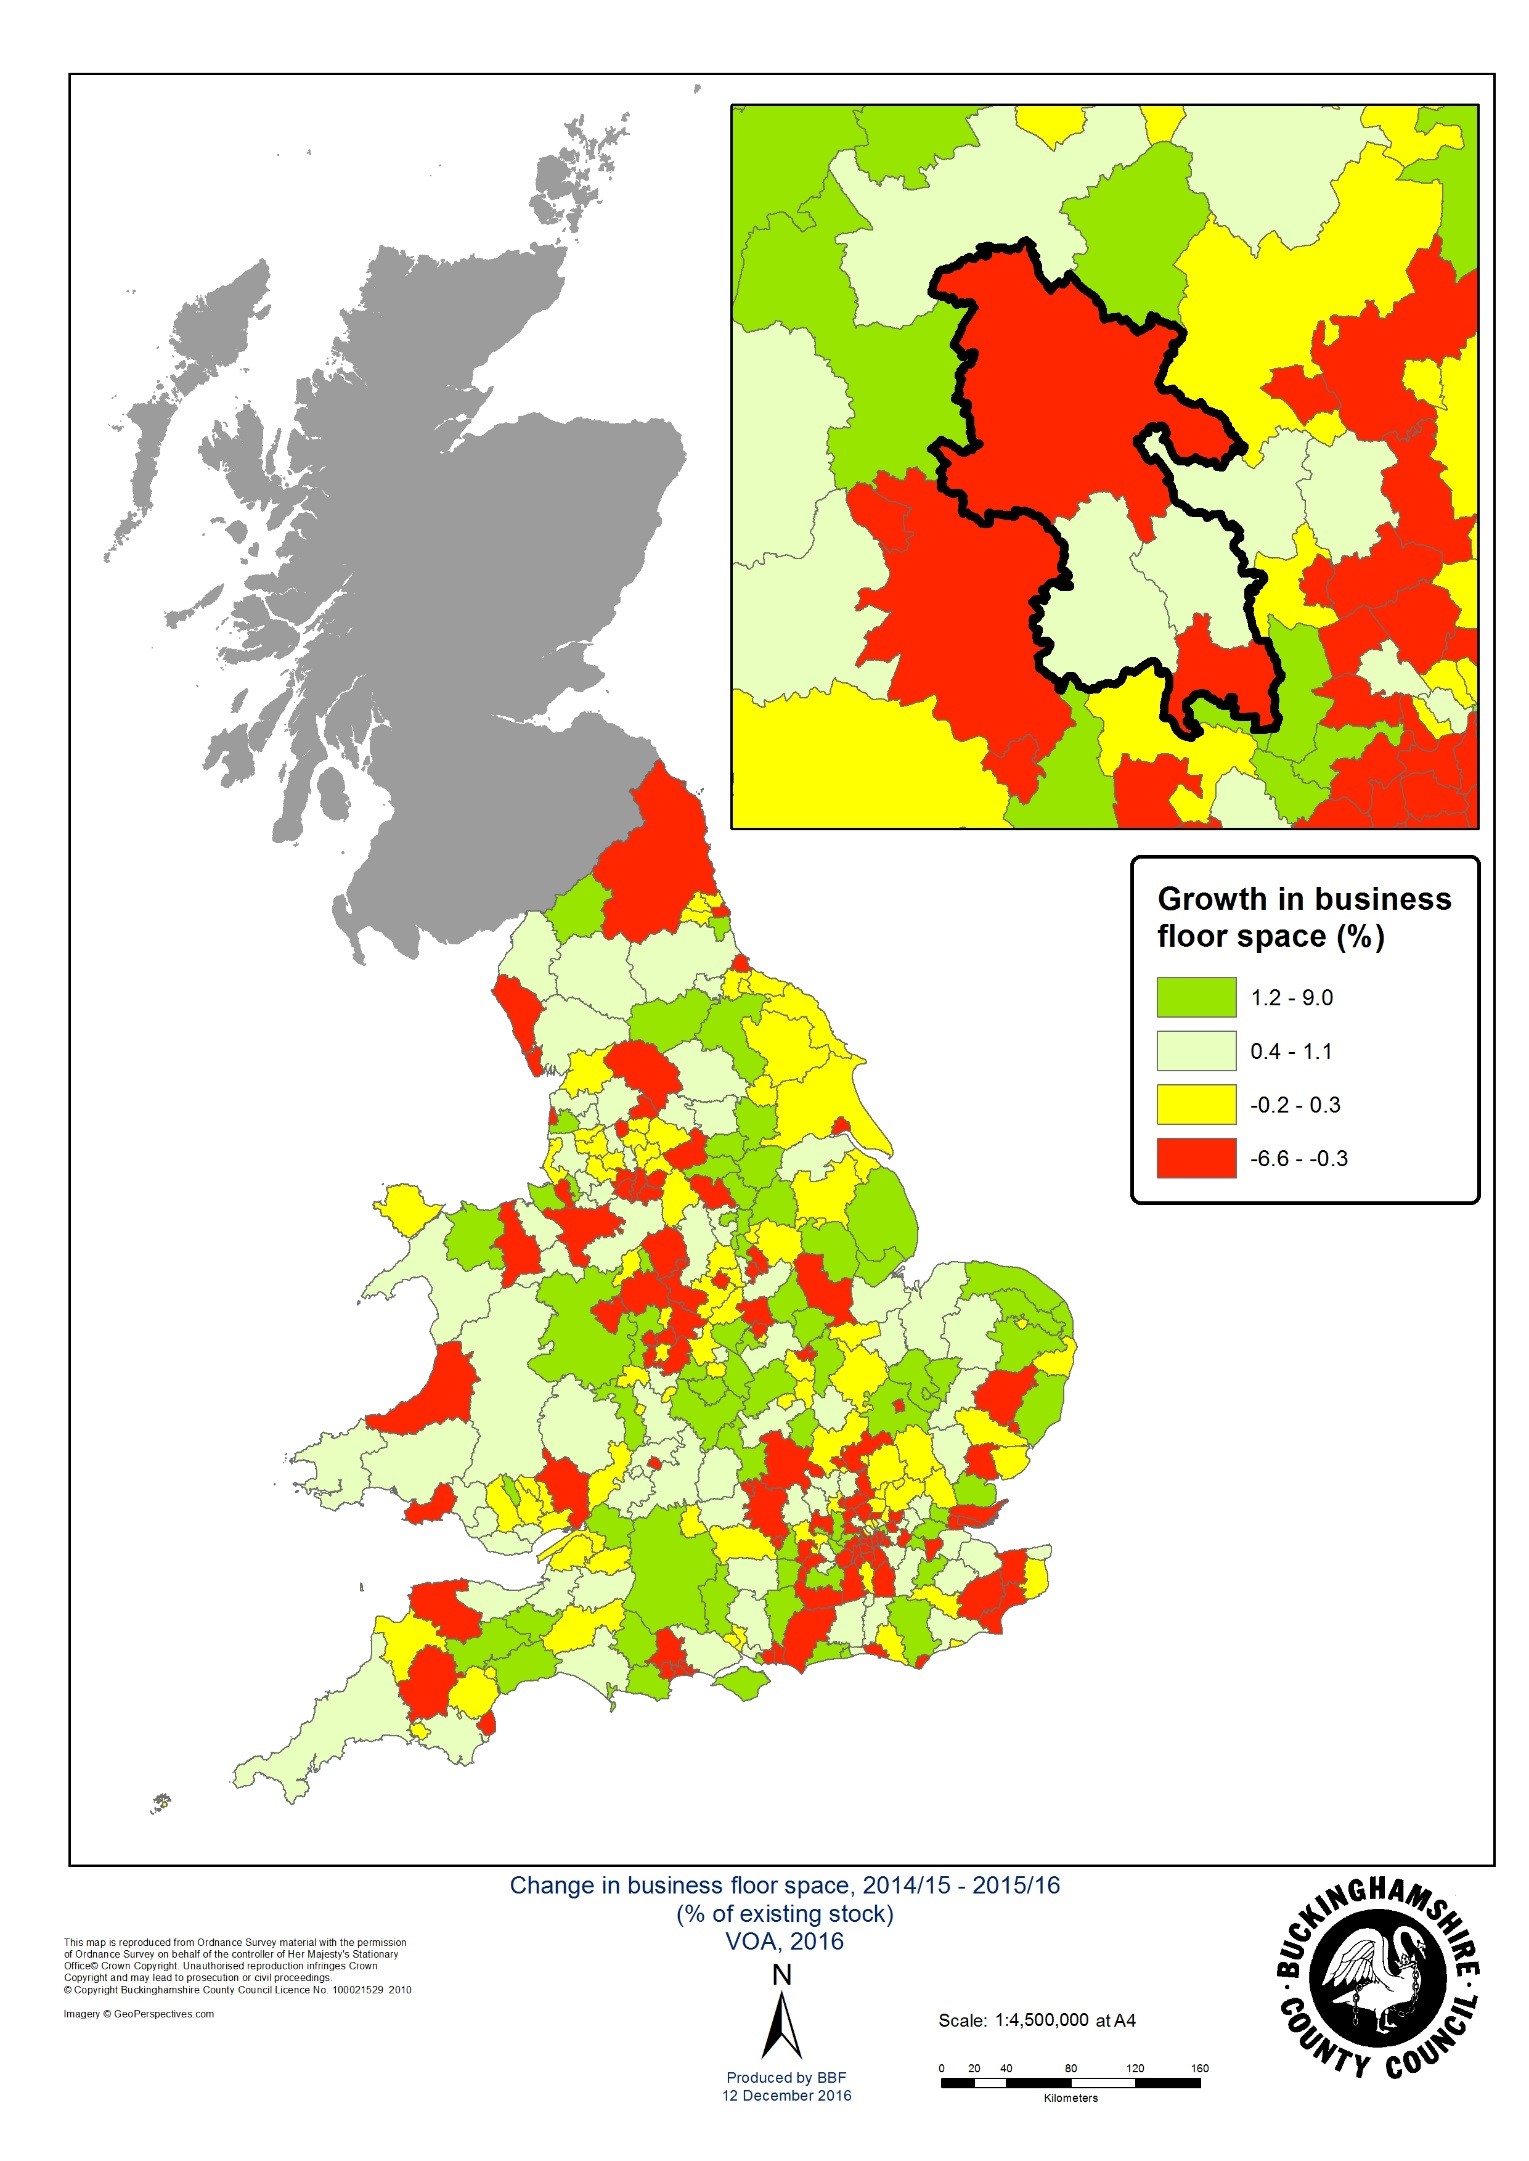
Between 2008 and 2016, Buckinghamshire’s business floorspace increased by 11,000m2, or 0.3 per cent, the 21st highest rate of increase among the 38 (LEPs) but well above the 0.3 per cent fall recorded across England. Over that period Buckinghamshire added 67,000m2 of retail space and 64,000m2 of other floorspace, increases of 10.5 and 10.9 per cent respectively, ranking 1st and 4th among LEPs. Conversely, office floorspace fell by 4.3 per cent (37,000m2) the 2nd weakest performance of any LEP, while industrial floorspace fell by 3.8 per cent (80,000m2) to rank 21st among LEPs.
Office floorspace and rateable value have fallen in Buckinghamshire in each of the last four years, now accounting for 21.1 per cent of rateable value, down from 2003/4’s peak of 31.1 per cent. Retail’s share of rateable value has risen for a second successive year to a new high of 27.1 per cent, while having fallen for six of the last seven years the share of Buckinghamshire’s rateable value derived from industrial floorspace rose to 22.2 per cent last year. Other floorspace which includes uses such as film studios, nurseries and creches, stables and wine bars accounts for 9.7 per cent with the excluded sector accounting for 19.9 per cent (including uses such as FE Colleges, cinemas, cemetaries and sports stadia).
The full dataset is available at: https://www.gov.uk/government/statistics/non-domestic-rating-business-floorspace
Chart 1: Change in business floorspace by district, 2008-16 (‘000m2)
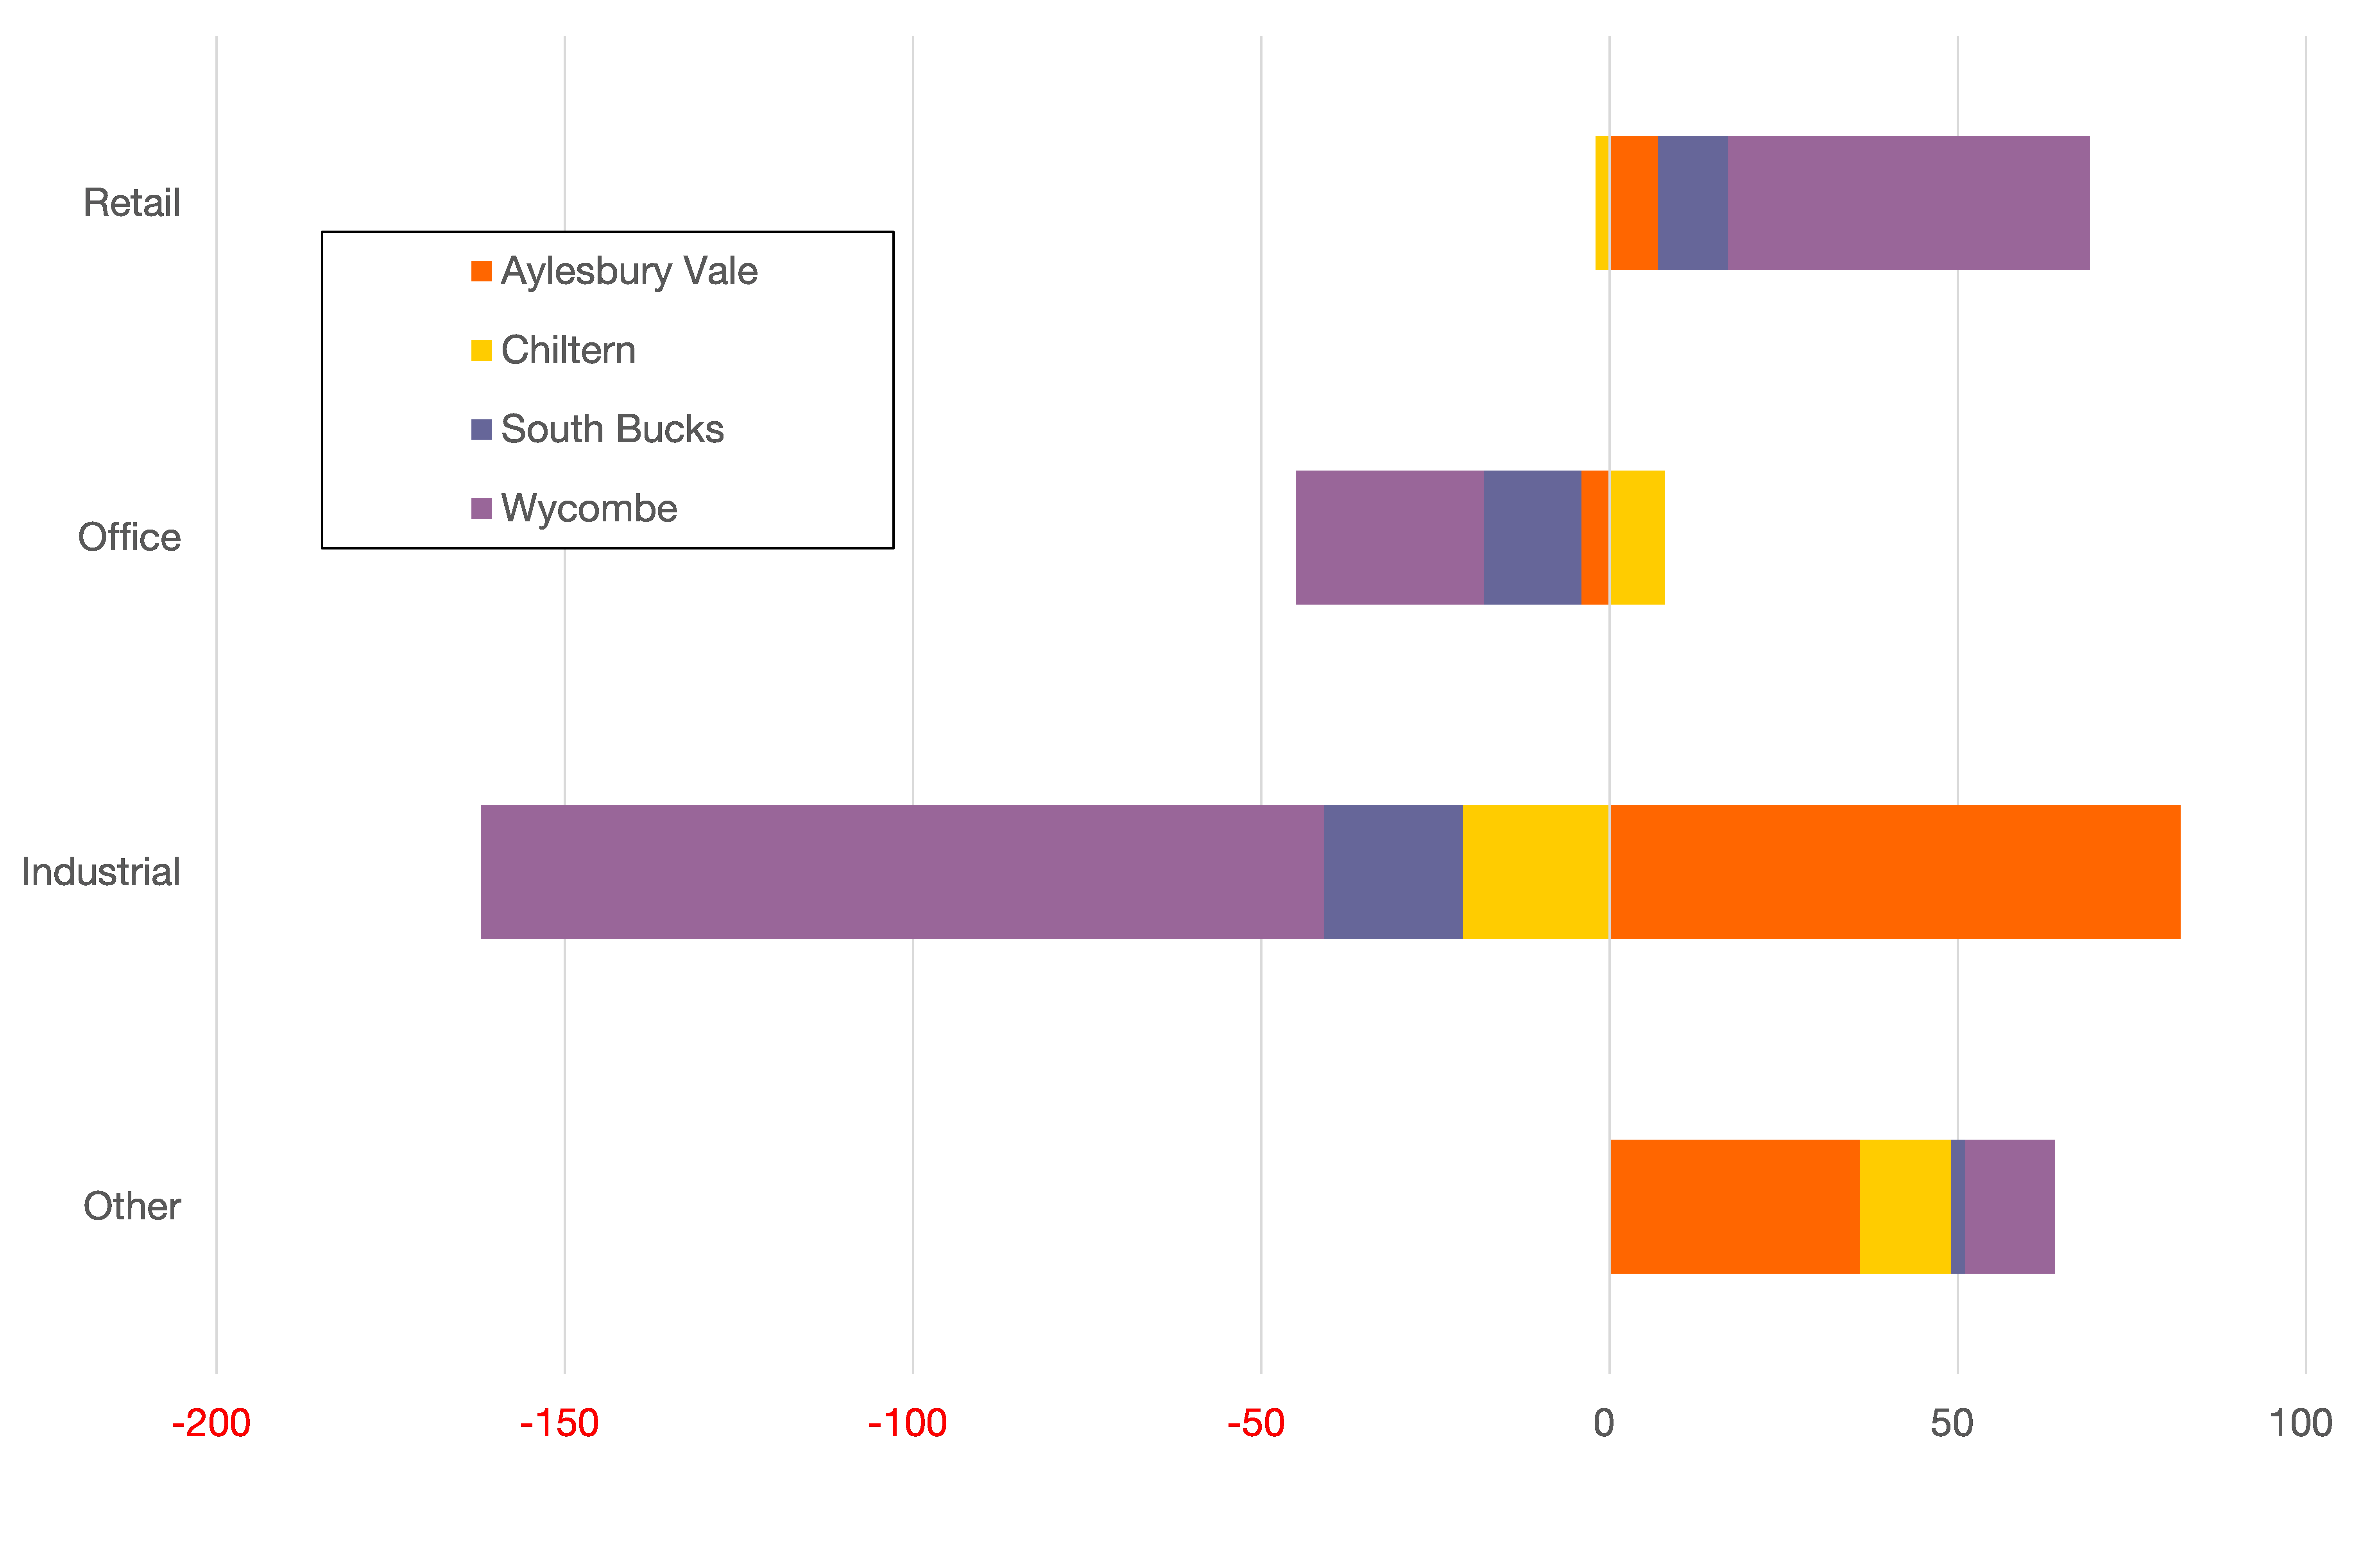
Source: Valuation Office Agency, 2016
Chart 2: Change in business floorspace in Buckinghamshire over time (‘000m2)

Source: Valuation Office Agency, 2016
Table 2: Business floorspace, properties and rateable value, 2015/16
Source: Valuation Office Agency, 2016
Table 3: Change in business floorspace over time, 2014/15 – 2015/16
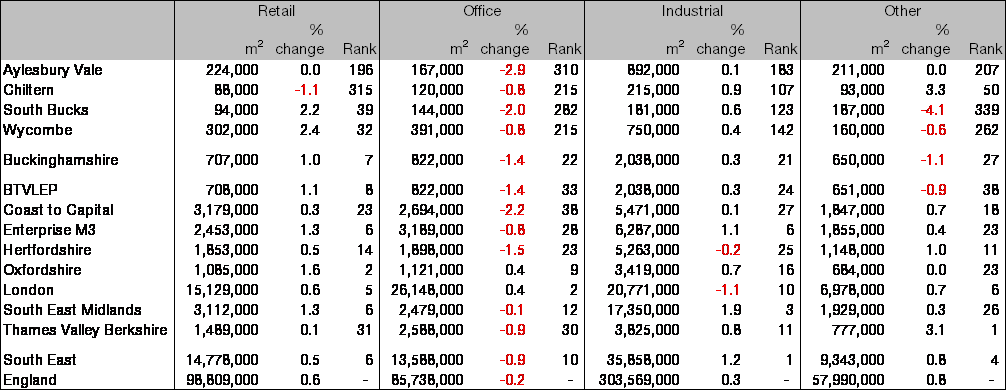
Source: Valuation Office Agency, 2016