
The number of people claiming unemployment-related benefits in Buckinghamshire rose by 4,025 between March 2020 and April 2020 to 9,565, an increase of 73%.
The rate of increase was the same for both men and women. Those in the 25-49-year-old age group appear to have initially been hardest hit. In March 2020, 55% of claimants were in this age group, compared to 58% in April 2020.
There is very little variation in the impact of COVID-19 on the claimant count within Buckinghamshire. Wycombe continues to have the highest claimant count rate, and Chiltern and South Bucks the lowest.
Table 1: Number of claimants and claimant rate (as a % of all residents aged 16-64)

Source: Claimant Count, DWP (accessed via NOMIS)
National context
When comparing Buckinghamshire to the rest of the country, we are reminded how strong the local labour market is. Whilst the claimant count rate (the number of claimants as a proportion of residents aged 16-64) rose from 1.7% to 2.9%, it remains very low in comparison to most other parts of England. It is lower than the national average (5.1%) and is the second lowest rate of all Local Enterprise Partnership (LEP) areas with only Oxfordshire having a lower rate (chart 1).
Buckinghamshire experienced the smallest increase in its claimant count rate of all LEP areas (a 1.2 percentage point increase between March and April 2020).
In fact, the six LEP areas with the smallest increases in claimant count rates are all in the OxCam Arc / Thames Valley area (table 2), suggesting that this area has been the most resilient part of the country in relation to the initial economic impact of COVID-19.
Background
The claimant count is a measure of the number of people claiming benefits principally for the reason of being unemployed. It is based on administrative data from the benefits system. As not all those who are unemployed will claim benefits, it is a subset of all those who are unemployed. It provides a useful indication of how unemployment is likely to vary between areas.
Due to changes to the benefits system in recent years, the ‘alternative claimant count’, rather than the ‘claimant count’, is the best measure for undertaking time series analysis. The first alternative claimant count data that will take into account the impact of COVID-19 will be published in July.
In the meantime, the release of claimant count data on 19th May 2020 provides us with the first initial picture of the impact of the COVID-19 lockdown on local labour markets. The data published for April 2020 relates to the month to 9th April, two and a half weeks into the lockdown.
Chart 1: Claimant count rate by LEP area, March 2020 and April 2020
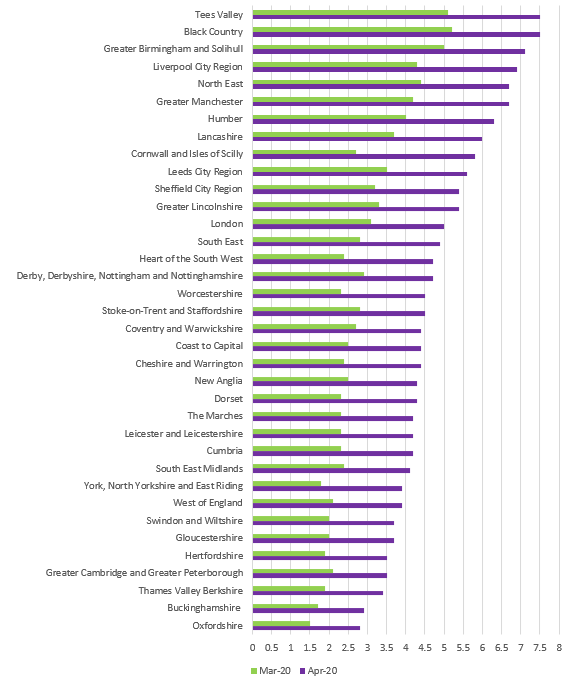
Source: Claimant Count, DWP (accessed via NOMIS)
Table 2: LEP areas with smallest percentage point increase in claimant count rate (March – April 2020)
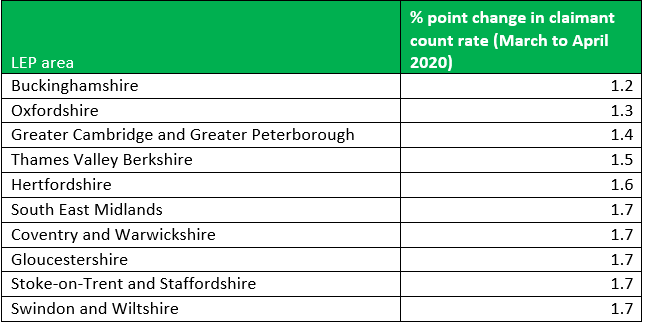
Source: Claimant Count, DWP (accessed via NOMIS)