Despite rising for a second successive month in July, Buckinghamshire’s average house prices have fallen 1.3 per cent over the last year to stand at £405,615.
Prices in Buckinghamshire are 75 per cent above the national average and the second highest among England’s 27 county council areas. While Aylesbury Vale has seen the fastest rise in prices of the four Buckinghamshire districts over the last year, the 1.7 per cent rise ranks only 261st highest among the 380 local authority districts in Great Britain and well below national and regional rates of growth (3.0 and 2.7 per cent respectively).
Table 1: Mean house prices, July 2018
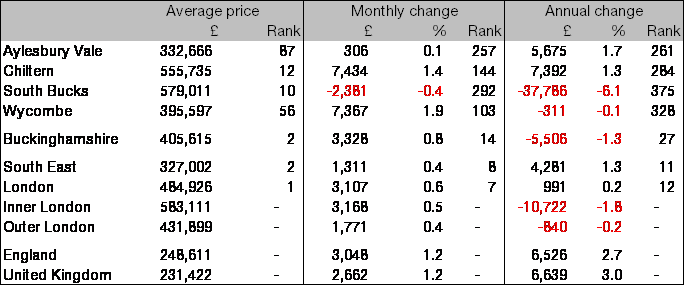
Source: Land Registry, 2018
Over the last year the average price of flats in Buckinghamshire has fallen by 2.8 per cent (£6,611), with falls recorded in all four districts. All other property types have seen prices continue to rise, led by a 1.4 per cent rise in the price of detached houses (£10,273), despite a 4.8 per cent fall being recorded in South Bucks.
Table 2: Mean house prices & annual change by property type, July 2018
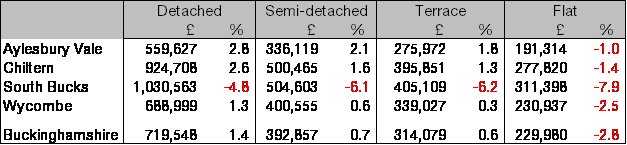
Source: Land Registry, 2018
There were 538 house sales in Buckinghamshire in May, taking the total for the last year to 8,082, the lowest for any 12 month period since the end of September 2013, 20.9 per cent below the post-recession peak of 10,220 reached in the year ending March 2016, and 37.8 per cent below the all-time high of 12,987 sales recorded in the year ending June 2000. The fall in sales in the last year has been most marked in Wycombe where they fell 14.1 per cent to stand at 2,526 in the last year. Even in Chiltern where sales were most resilient, sales have fallen in the last year by 9.1 per cent to 1,334, well below the national fall of 1.0 per cent.
Chart 1: House sales over time (year to May 2006 = 100)
Source: HM Land Registry, 2018
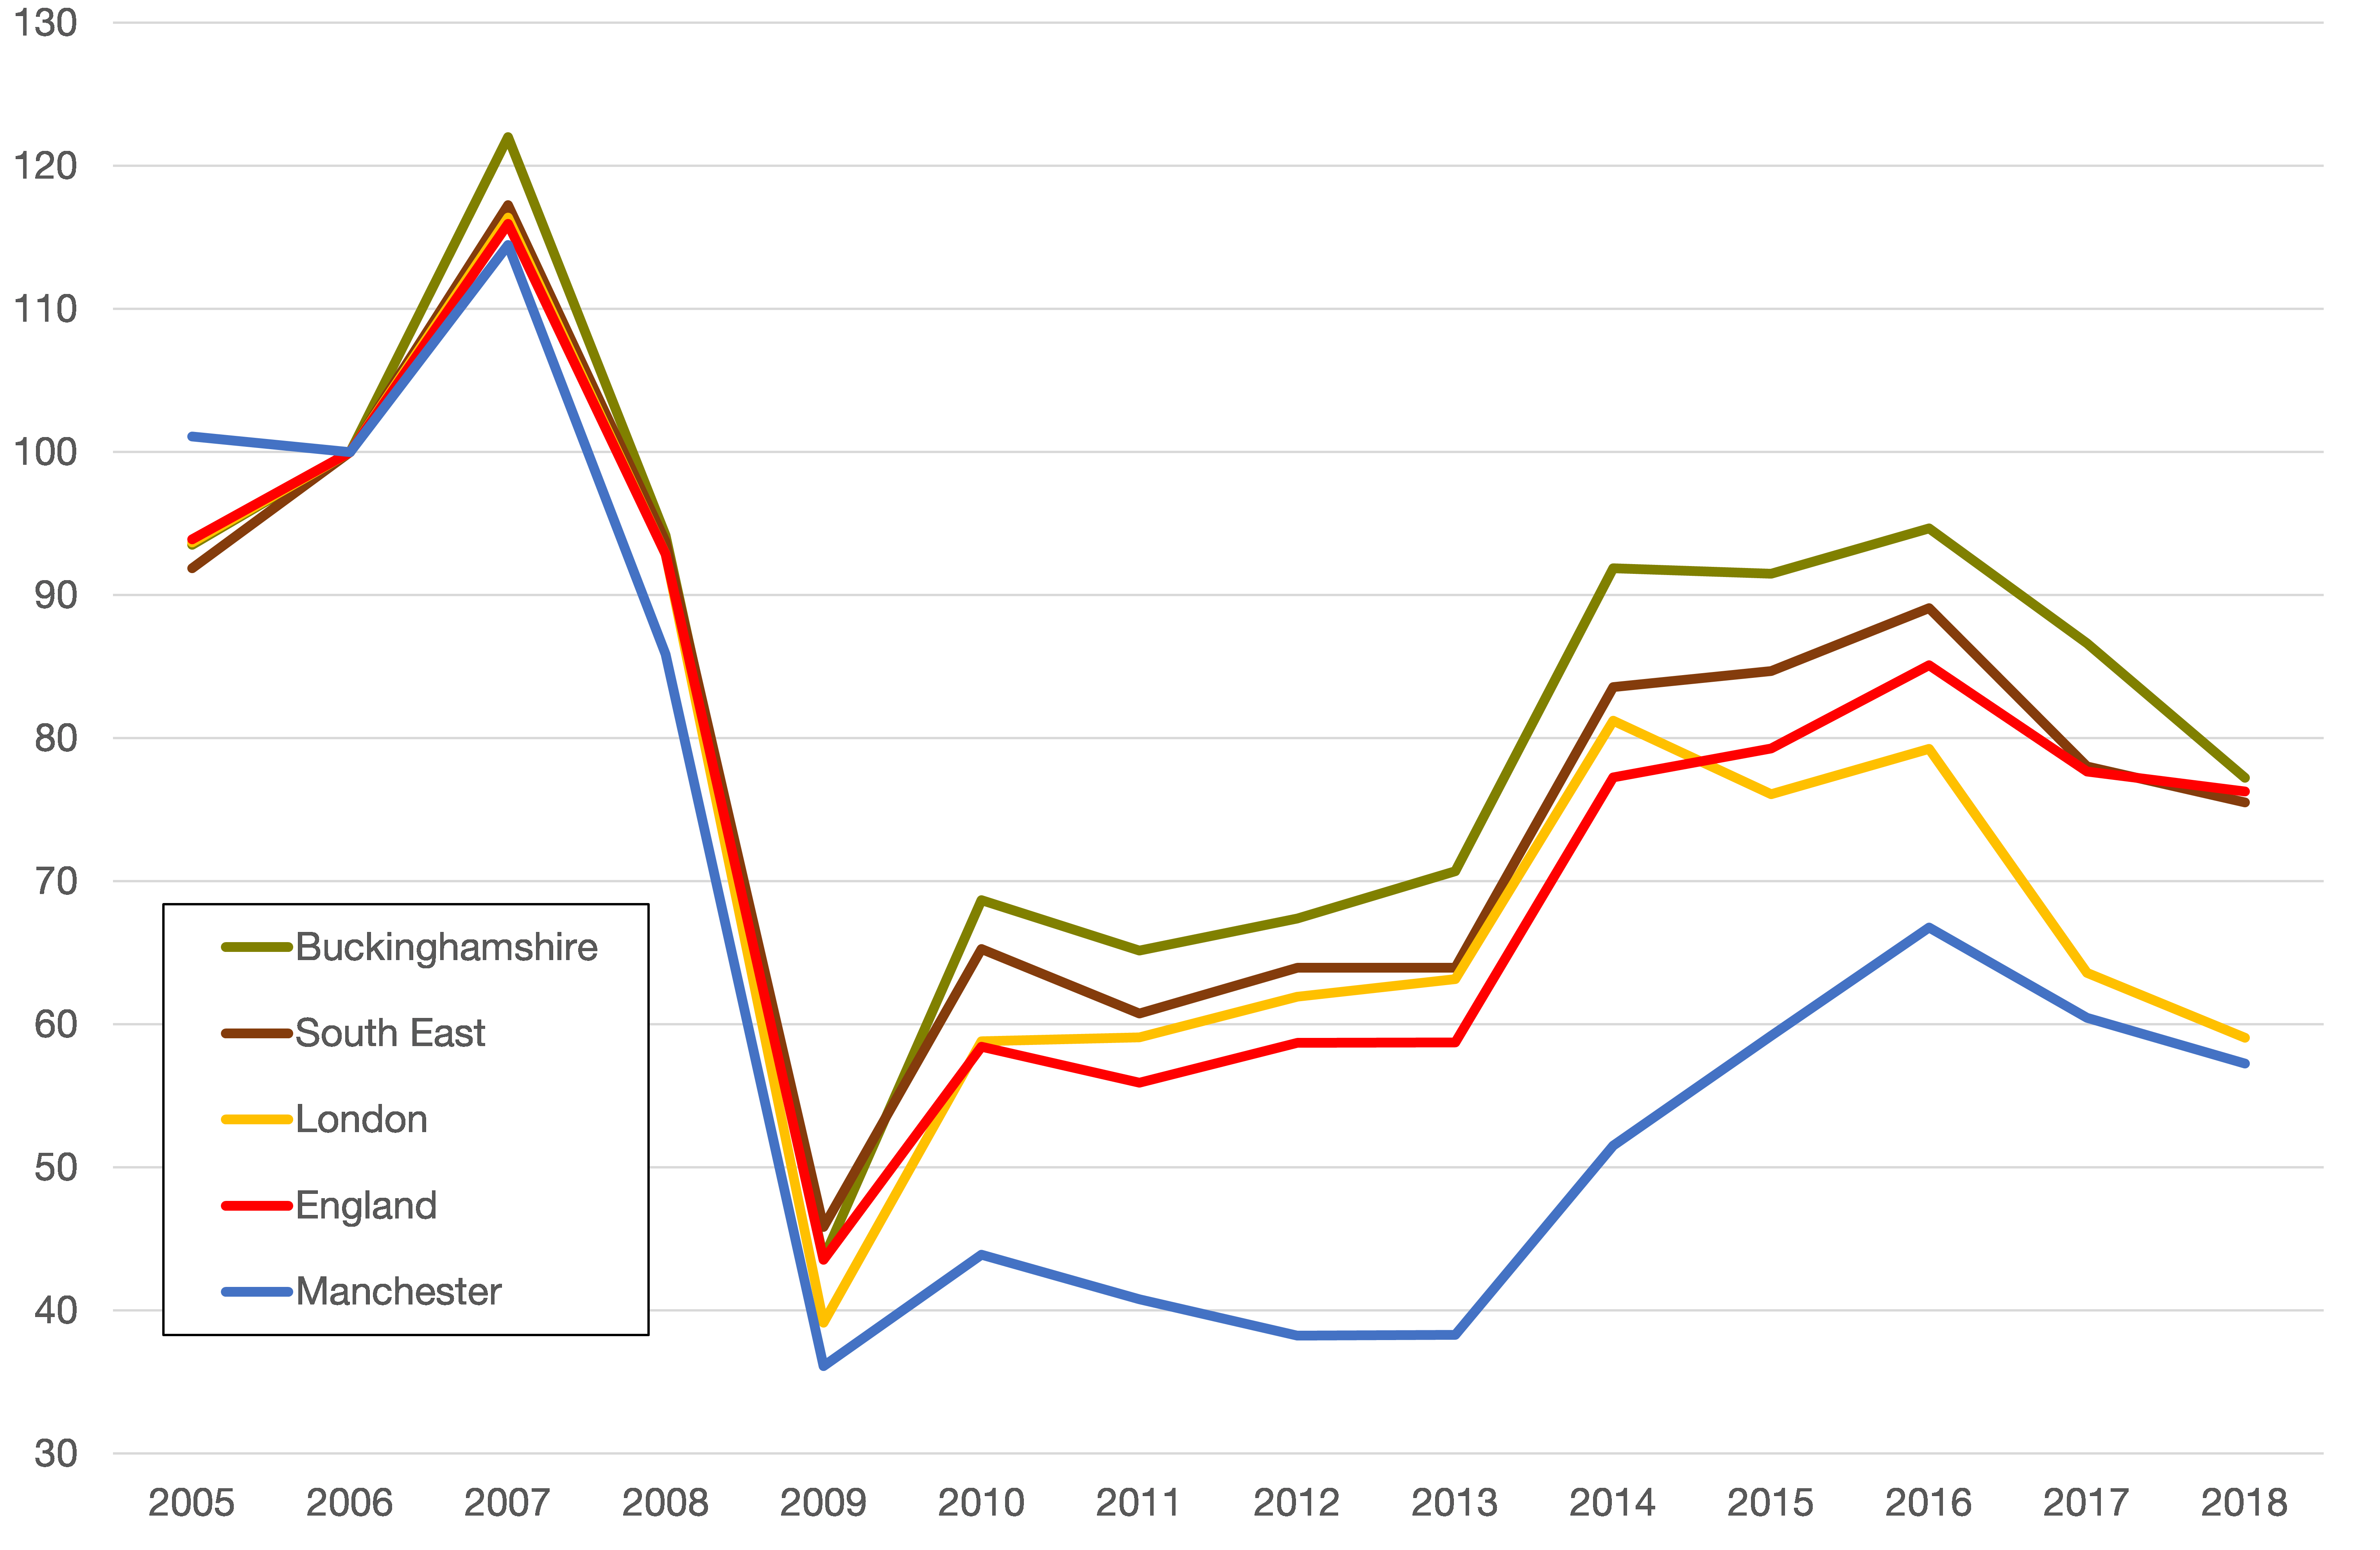
Chart 2: Mean house prices over time (July each year, 2008 = 100)

Source: HM Land Registry, 2018