There were 242,000 people employed in Buckinghamshire in 2016, an increase of 9,000 over the previous year. At 3.0 per cent, Buckinghamshire has the 8th highest rate of increase among both England’s 27 county council areas and 38 Local Enterprise Partnerships (LEPs), well above the national (1.6 per cent) and regional (1.9) rates of growth.
Among Buckinghamshire’s districts, Wycombe recorded the strongest growth at 5.7 per cent in the last year, the 22nd strongest growth of all 380 local authorities in Great Britain, led by a 6.6 per cent rise in private sector employment. Chiltern saw total employment fall by 1.8 per cent in 2015, including a 7.6 per cent fall in public sector employment. Aylesbury Vale was the only Buckinghamshire district to see public sector employment rise.
Table 1: Total employment and annual change by public and private sector, 2016

Source: BRES, ONS, 2017
Private sector employment grew 3.8 per cent over the last year, the 5th strongest growth among LEPs, while Buckinghamshire’s 3.0 per cent fall in public sector employment was the 4th weakest performance. The public sector now accounts for only 11.4 per cent of all jobs, the lowest rate recorded in any LEP and third lowest among county councils, behind Surrey and Leicestershire.
Over the last year, part-time employment rose in Buckinghamshire by 7.1 per cent compared to a rise of just 1.3 per cent in full-time employment. Part-time roles now account for almost a third (32.0 per cent) of all employee jobs in Buckinghamshire. Part-time employment is concentrated in a few sectors, with 65.3 per cent of part-time work in Buckinghamshire occurring in just five broad industry groups, which account for only 34.5 per cent of full-time jobs. Part-time roles make up more than half of all employment in Buckinghamshire’s retail and accommodation and food service sectors at 58.5 and 57.1 per cent respectively, ahead of education (46.5), arts, recreation and culture (45.5) and health (41.5). More than half of all additional part-time roles added in the last year were in either the transport and storage or health sectors, with professional, scientific and technical and business administration both seeing part-time roles rise by 1,000, with construction (750) and retail (500) also seeing large rises.
Chart 1: Share of employees in full-time roles in Buckinghamshire by sector (%), 2016

Source: BRES, ONS, 2017
By broad industrial group, health employs the most people in Buckinghamshire, with 26,500 jobs in the sector, ahead of the professional, scientific and technical sector (24,500), and education and retail (both 21,500). At the two digit level, education and retail are the largest sectors, both providing 21,500 jobs, ahead of wholesale (20,500), human health activities (15,000), and food and beverage service activities (12,500).
Over the last year, business administration and support services has added the most jobs in Buckinghamshire, with employment up 3,500 (18.4 per cent) since 2015. Other sectors showing strong growth include manufacturing and wholesale, both up 2,000 (12.9 and 10.8 per cent respectively), and transport and storage and construction, both up 1,000 (23.1 and 13.0 per cent respectively). Education recorded the largest fall at 1,500, with part-time roles accounting for almost two thirds of that reduction. The full results are presented in chart 1 below.
By location quotient, Buckinghamshire has the greatest concentration of jobs in wholesale (LQ=2.2), information and communication (1.6), property (1.4), and the professional, scientific and technical sector (1.2). Buckinghamshire has the highest concentration of employment of all county council areas in wholesale, ranking 2nd in property and 4th in information and communication technologies. The full results are presented in table 2 below, which demonstrates that Buckinghamshire shares strengths with its neighbouring LEPs.
Chart 2: Change in total employment by broad industry group by district, 2015-16

Source: BRES, ONS, 2017
Table 2: Location quotients for broad industry groups, 2016
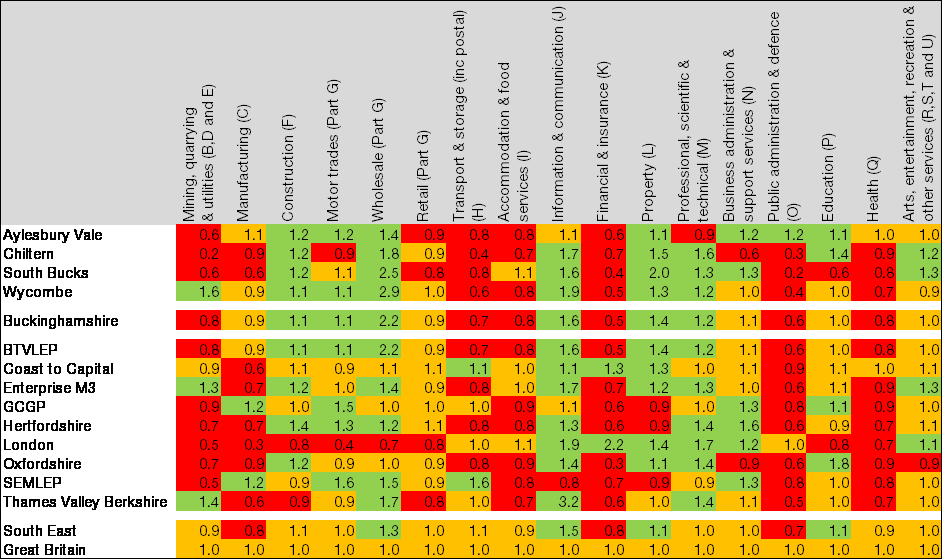
Source: BRES, ONS, 2017
Table 2: Employment by broad industry group, 2016

Source: BRES, ONS, 2017