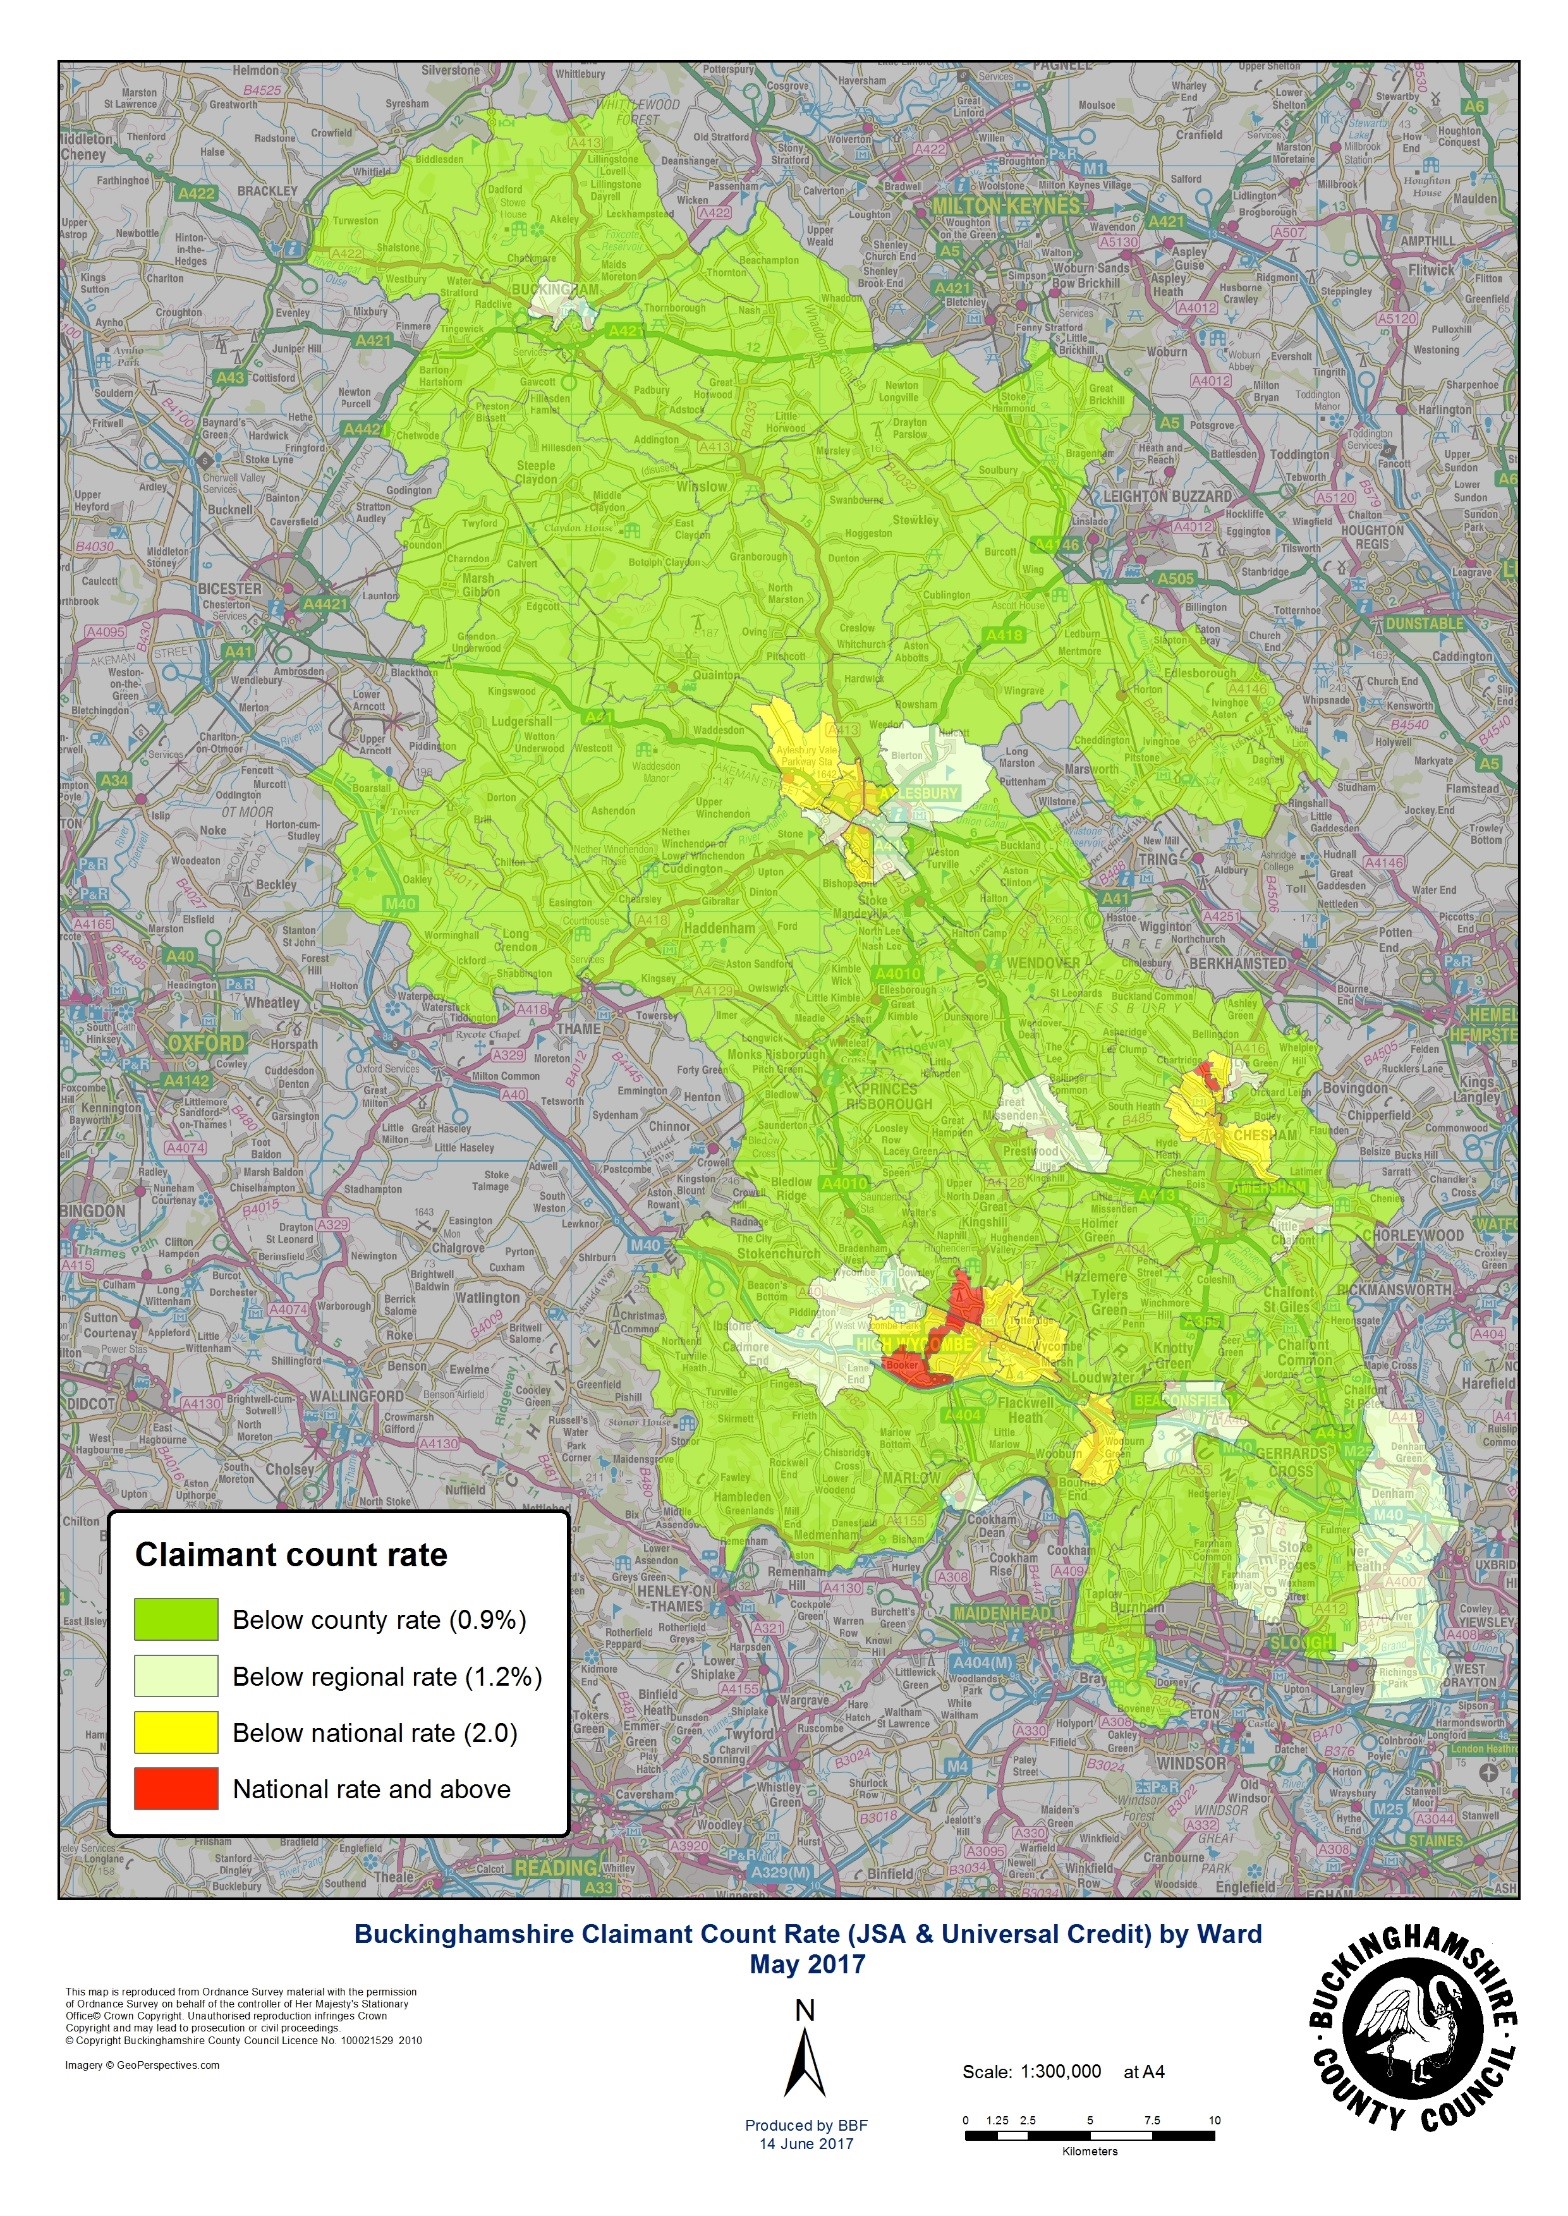
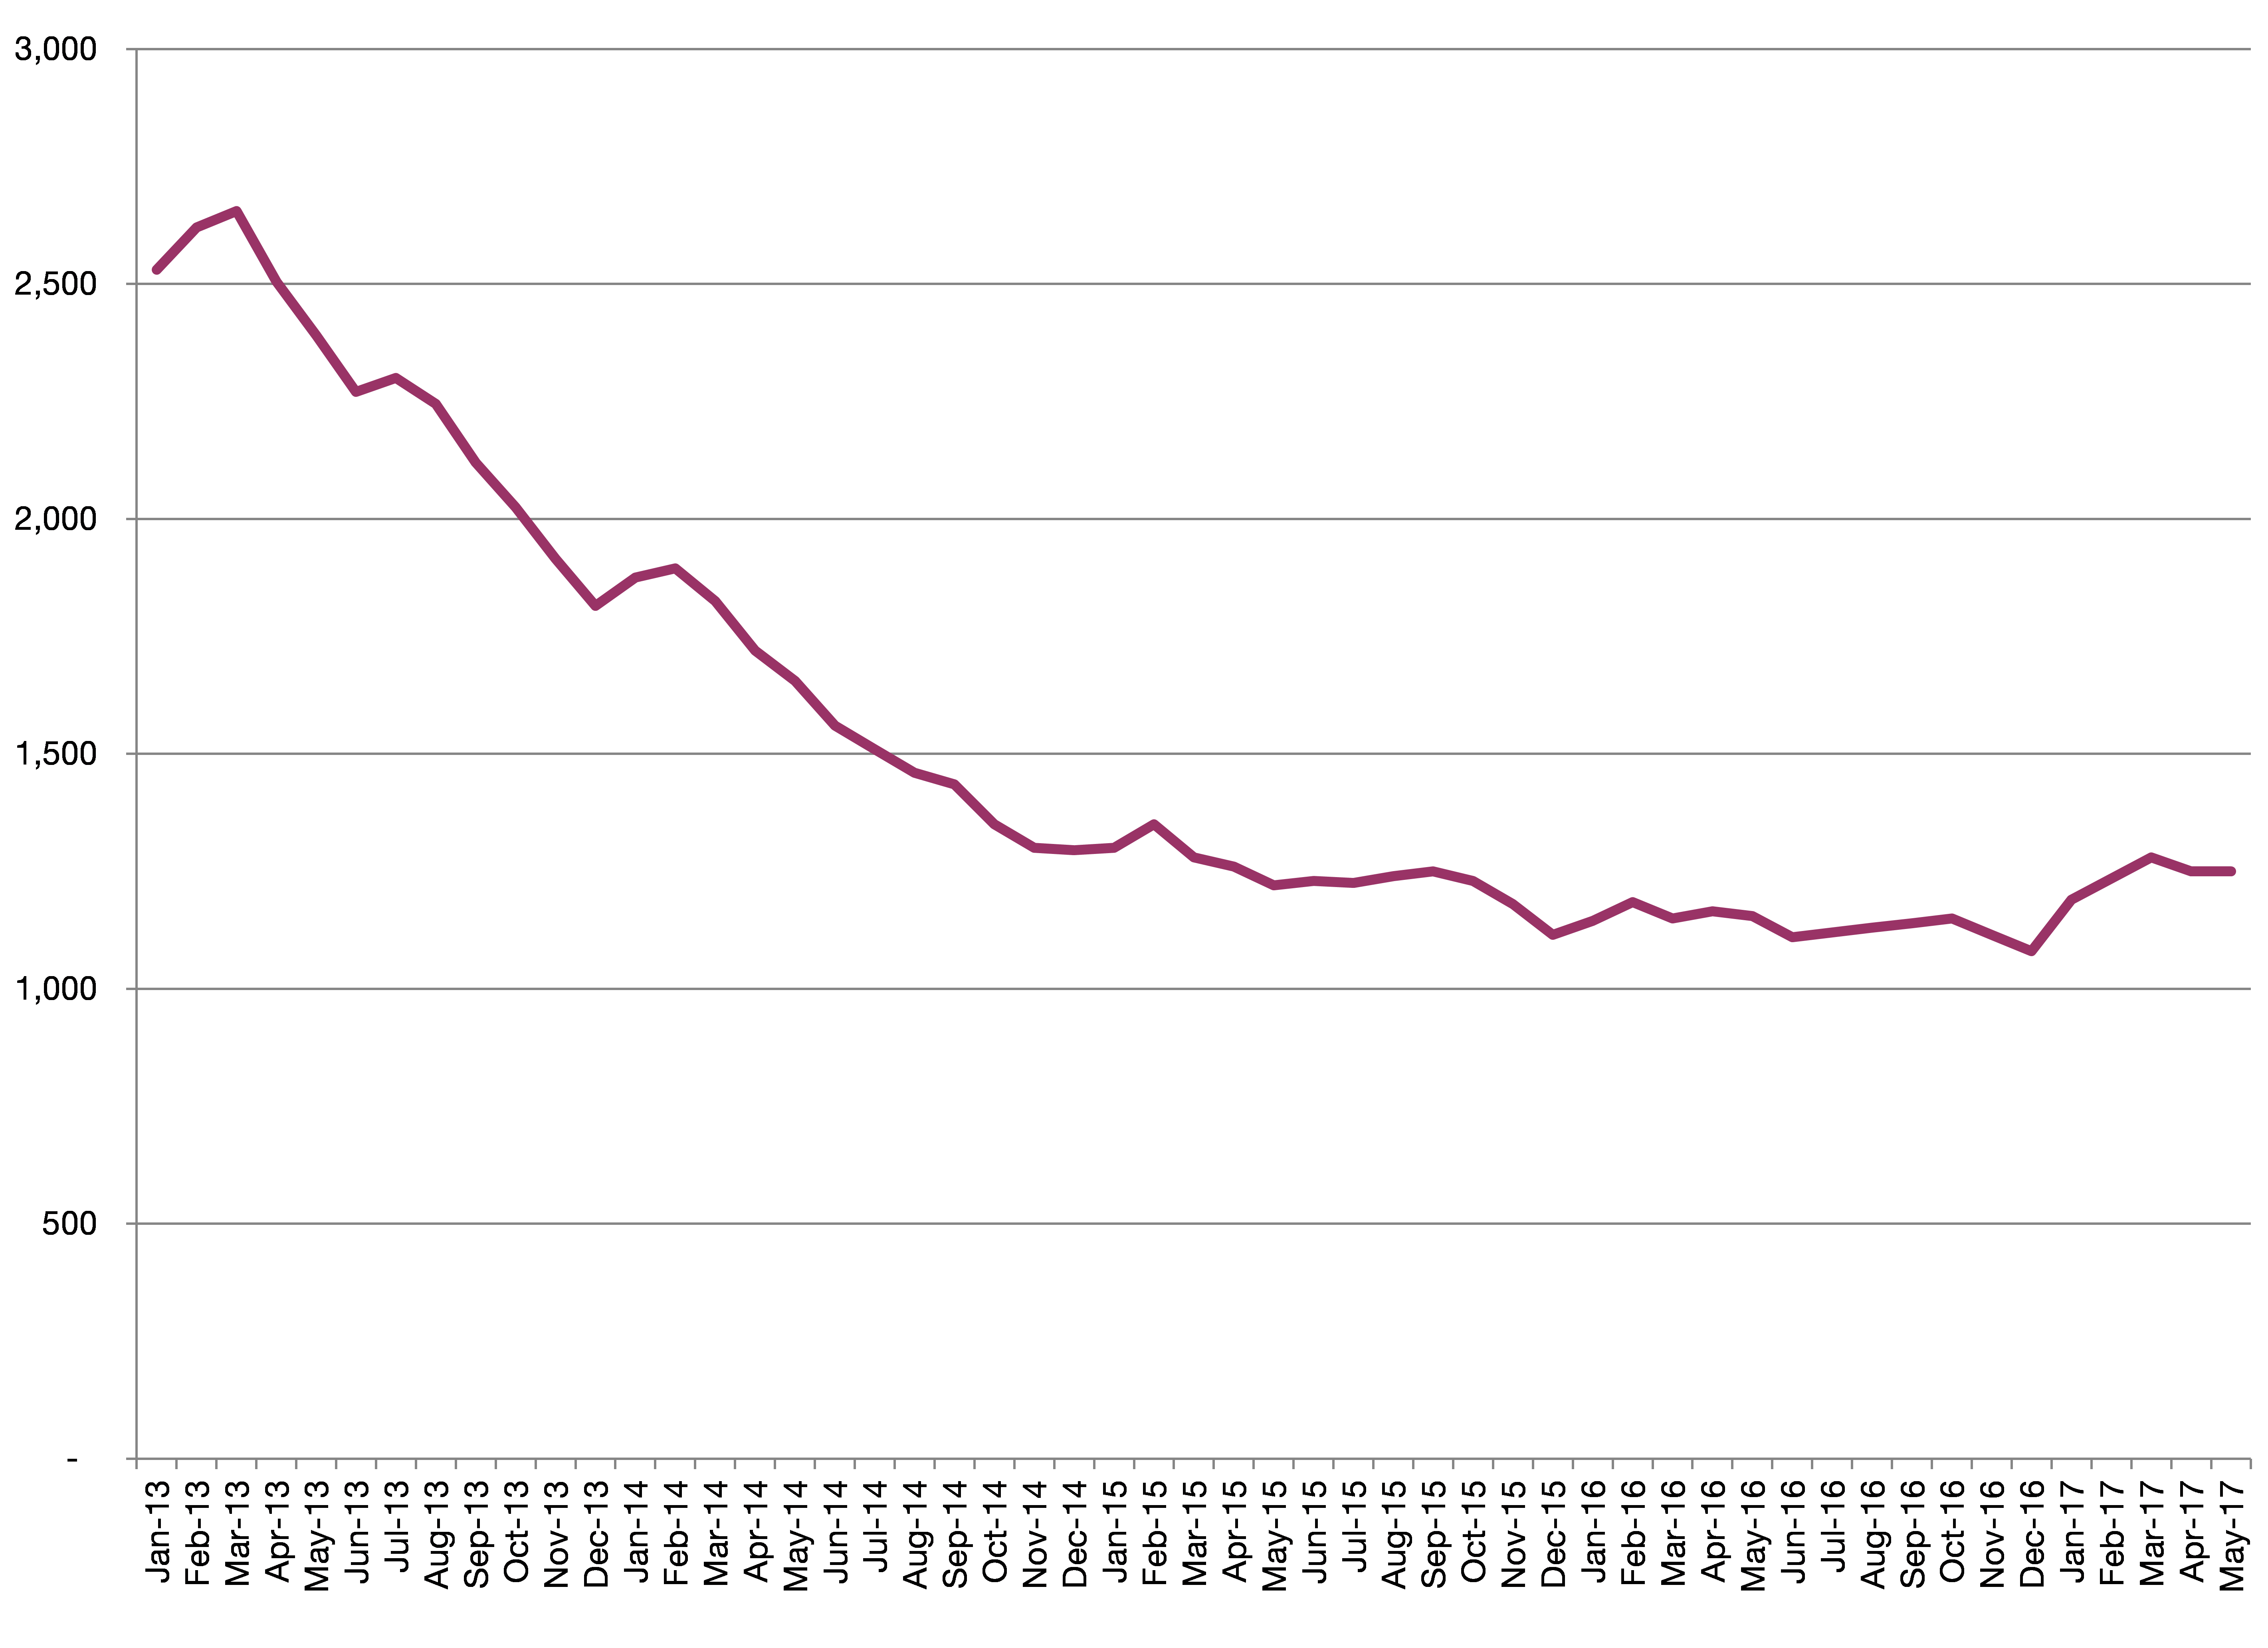
The number of out of work Buckinghamshire residents claiming either Job Seekers’ Allowance or Universal Credit rose by 50 in May, rising above 3,000 for the first time since February 2015.
The claimant count rate was unchanged at 0.9 per cent of working age residents, less than half the national rate, ranking 3rd lowest among the 38 Local Enterprise Partnerships (LEPs) and 5th lowest among England’s 27 county council areas.
The increase was most pronounced in Aylesbury Vale, where an increase of 50 claimants took the claimant count rate to 0.9 per cent, only the 70th lowest rate among the 380 local authority districts in Great Britain, the district’s poorest ranking since June 2014. Over the last year the claimant count in Aylesbury Vale has risen by more than a quarter, the 35th highest rate in Great Britain. Despite this rise at the district level, no wards in Aylesbury Vale have a claimant count rate above the national level.
Table 1: Claimant Count, May 2017
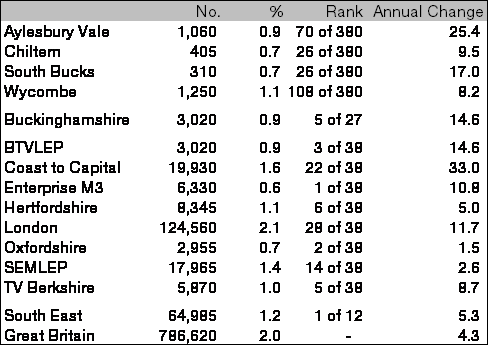
Source: DWP, 2017
There were 6,555 advertised job openings in Buckinghamshire in May, 888 (15.7 per cent) more than in April and 1,302 (24.8 per cent) more than in May 2016. The most commonly advertised roles were programmers and software development professionals (285), secondary teaching professionals (248), business sales executives (237), other administrative occupations (173), nurses (162) and sales account and business development managers (144). Over the last year there have been 68,903 advertised job openings in Buckinghamshire. The industries with the most openings in the last year have been human health activities (6,551) ahead of manufacturing (4,474), education (4,394), accommodation and food service (3,559) and professional, scientific and technical activities (3,027).
When analysed by both industry and occupation, professionals in health and education had the most advertised job openings (2,886 and 2,854 respectively) ahead of personal service occupations in health (1,558), skilled trades in accommodation and food service (1,412), associate professionals in manufacturing (1,316) and professionals in professional, scientific and technical activities (1,282). More jobs for professionals were advertised than for SOCs 5, 6, 7, 8 and 9 combined. The full results are presented in table 4.
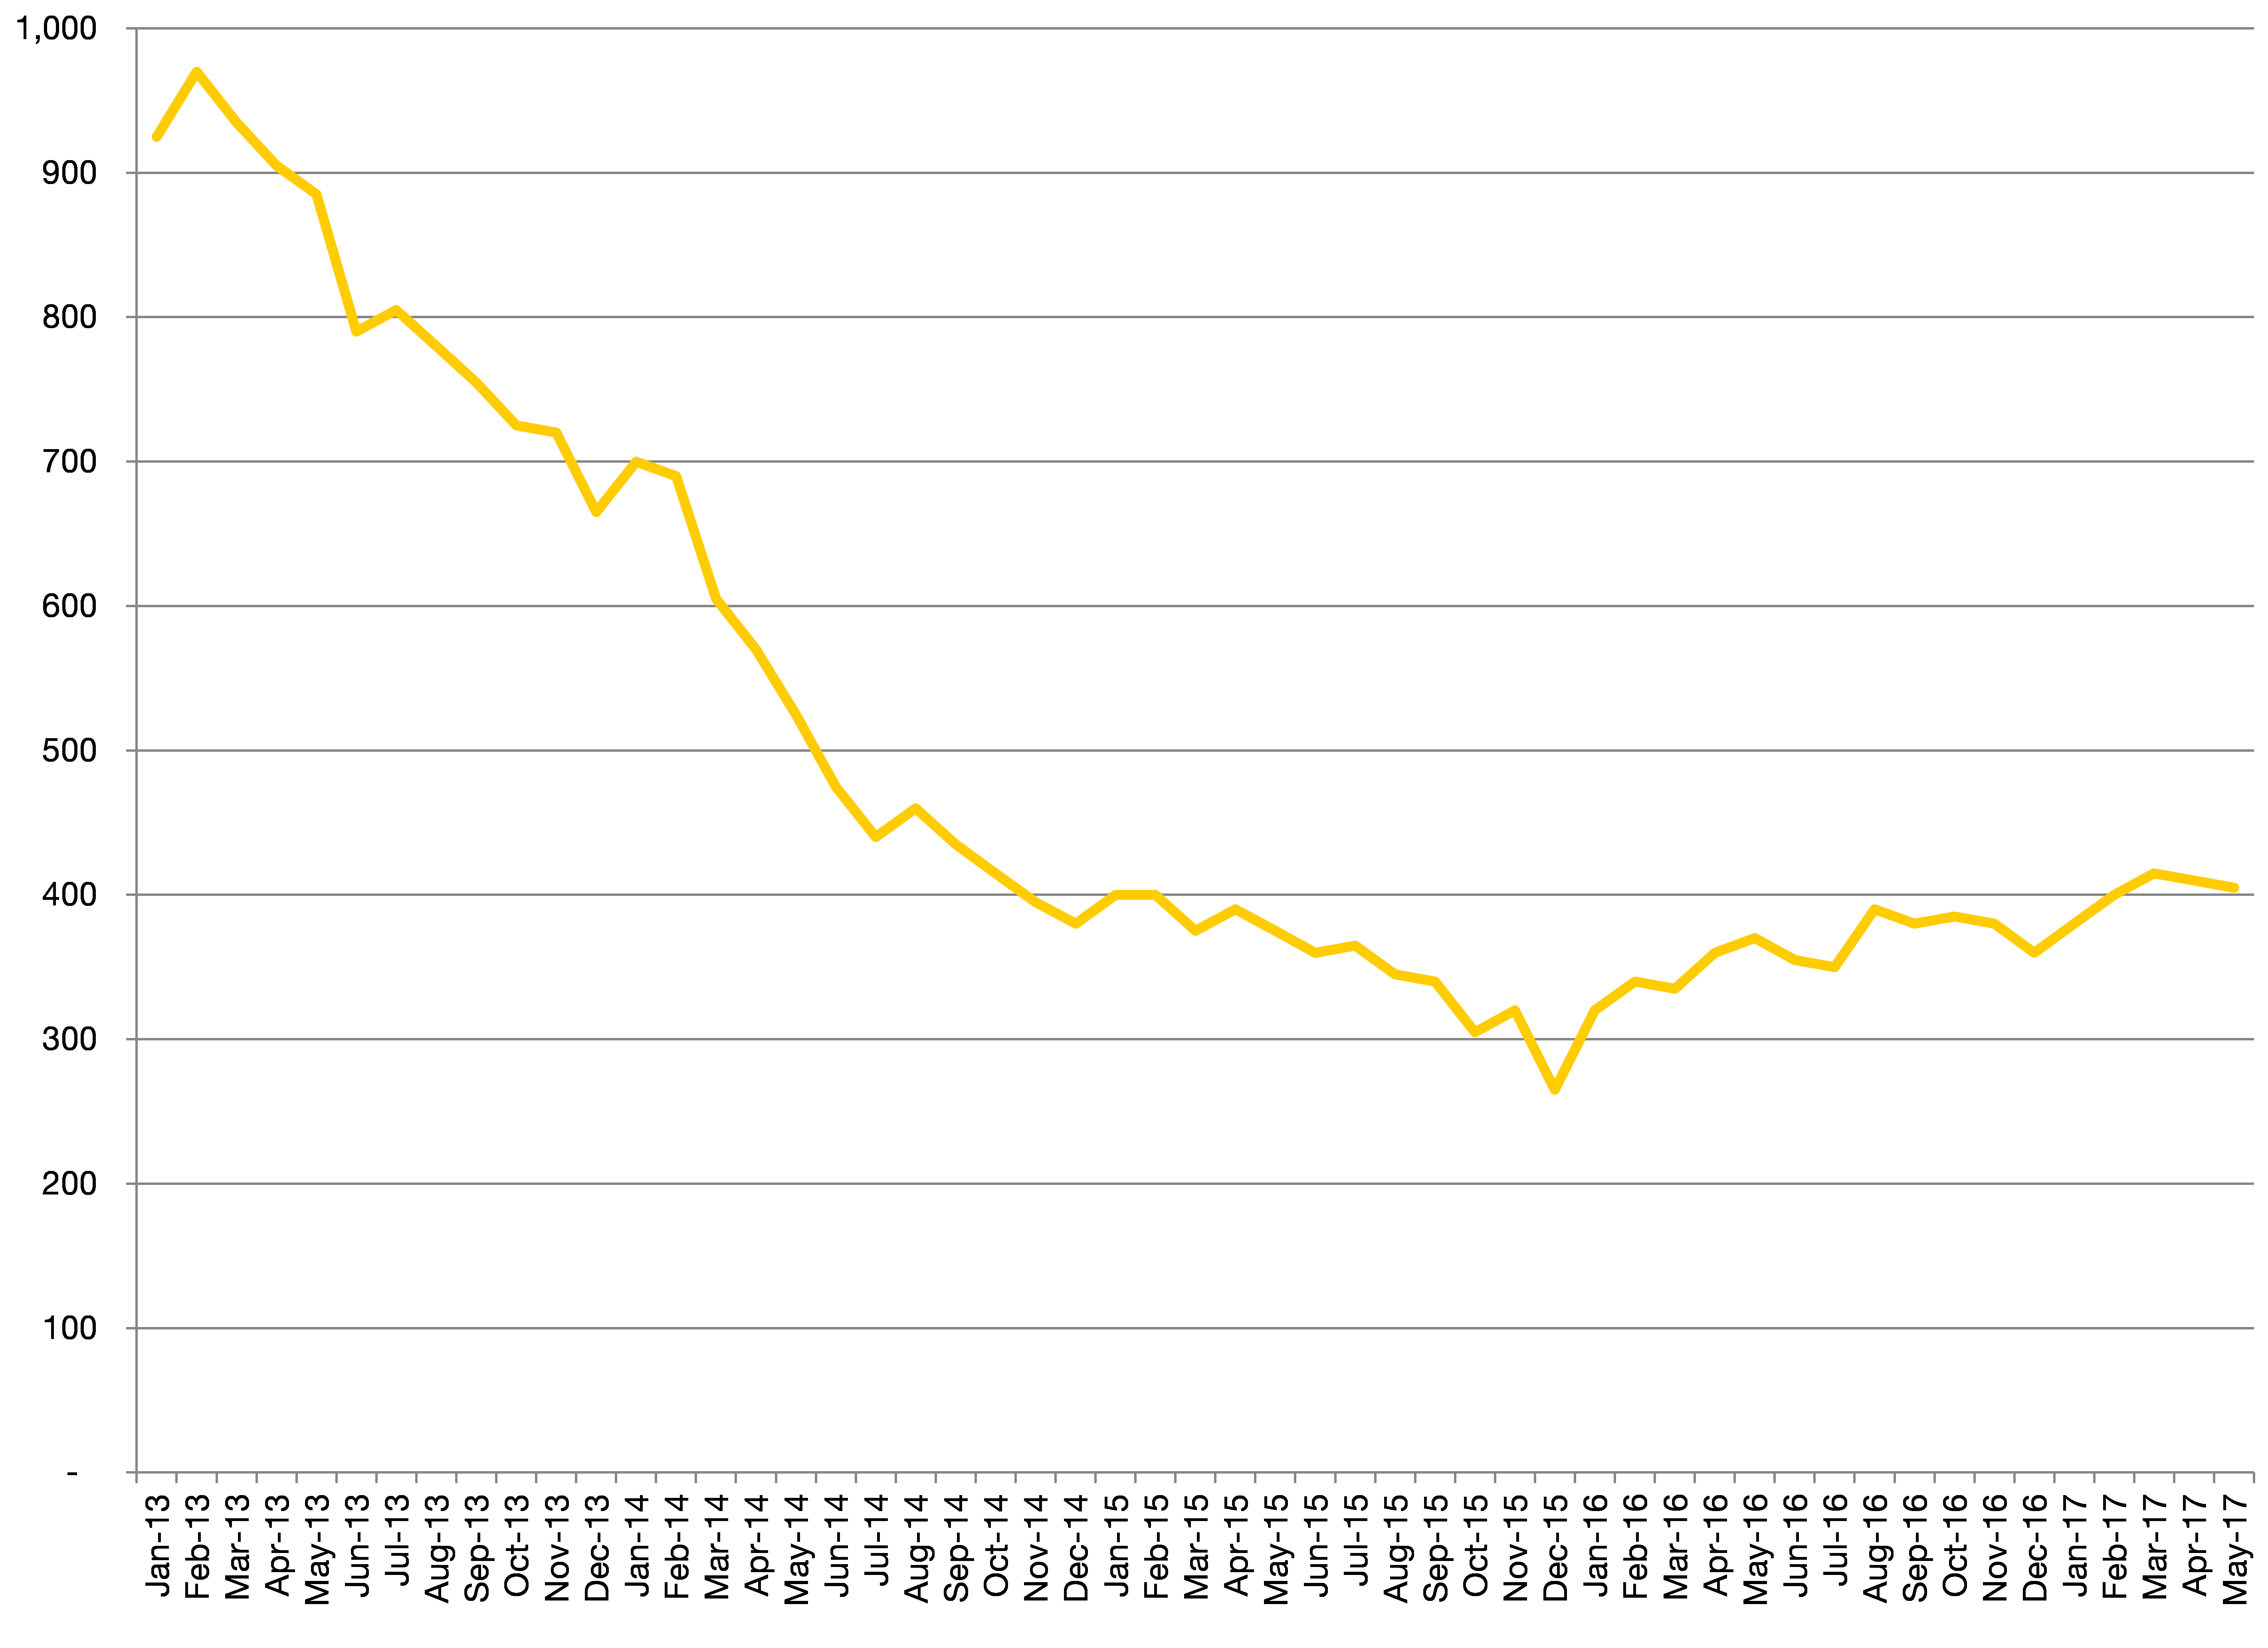
Chart 1: Buckinghamshire’s claimant count over time, to May 2017

Source: DWP, 2017
Table 2: Claimant count by sought occupation (JSA only), May 2017
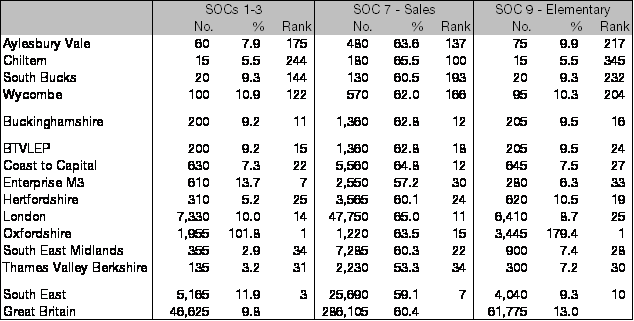
Source: DWP, 2017
Chart 2: Aylesbury Vale’s claimant count over time, to May 2017

Source: DWP, 2017
Chart 3: Chiltern’s claimant count over time, to May 2017
Source: DWP, 2017
Chart 4: South Bucks’ claimant count over time, to May 2017

Source: DWP, 2017
Chart 5: Wycombe’s claimant count over time, to May 2017
Source: DWP, 2017
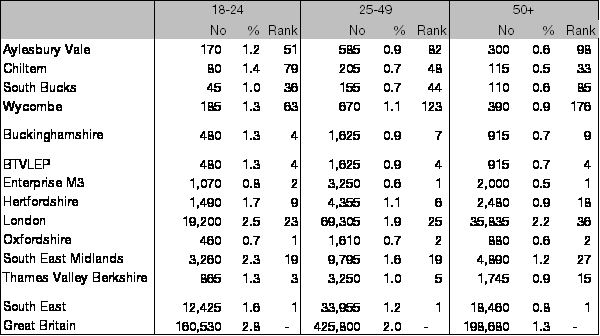
Table 3: Claimant count by age group, May 2017
Source: DWP, 2017
Table 4: Advertised job openings by occupation and industry, year ending May 2017

Source: Labour Insight, 2017
NOTE: To view the above table and report larger, a version is available to download at the bottom of this page.