
There were 1,468 new businesses registered in Buckinghamshire in the first quarter of 2019 (January to March), according to Companies House, the highest quarterly total since we began collecting this data in Q1 2016.
This brings the total of the last year to 5,310, again the highest four quarter total on record. Registrations in Buckinghamshire were 8.9 per cent higher in Q1 2019 than in Q1 2018 and rose 3.3 per cent compared to the last quarter of 2018.
Only eight of the 38 Local Enterprise Partnerships bettered England’s rate of new company registrations in the last quarter, with Buckinghamshire ranking 10th with 34.5 registrations for every 10,000 residents aged 16 or over. Buckinghamshire ranked 4th among county council areas behind Worcestershire (72.0), Hertfordshire (45.4) and Northamptonshire (38.0).
South Bucks recorded Buckinghamshire’s highest new registration rate with 48.4 registrations per 10,000 residents aged 16 or over, ranking 42nd among the 380 local authority districts in Great Britain and 18th highest outside London. Chiltern also bettered the national rate at 35.8 to rank 83rd, ahead of Wycombe (34.4, 86th) and Aylesbury Vale (28.9, 130th).
Table 1: Business registration rates, Q1 2019

Sources: Companies House, 2019; MYPE, ONS, 2018
Management consultancies (other than financial management) were the most commonly registered businesses in Buckinghamshire in the last quarter, with 113 registrations, or 8.0 per cent of the total, ahead of informational technology consultancies (81, 5.8), other service activities (77, 5.5), other letting or operation of own or leased real estate (54, 3.8), the buying and selling of own real estate (46, 3.6), other business support service activities (41, 2.9), the development of building projects (33, 2,3), retail sales via mail order houses or via Internet (30, 2.1), and residents’ property management (26, 1.8).
The geography of new company registration is presented in the map at the end of this bulletin.
Table 2: Local authorities’ business registrations per 10,000 residents (16+), Q1 2019

Sources: Companies House, 2019; MYPE, ONS, 2018
Table 3: New business registrations for every 10,000 residents (16+) by LEP, Q1 2019
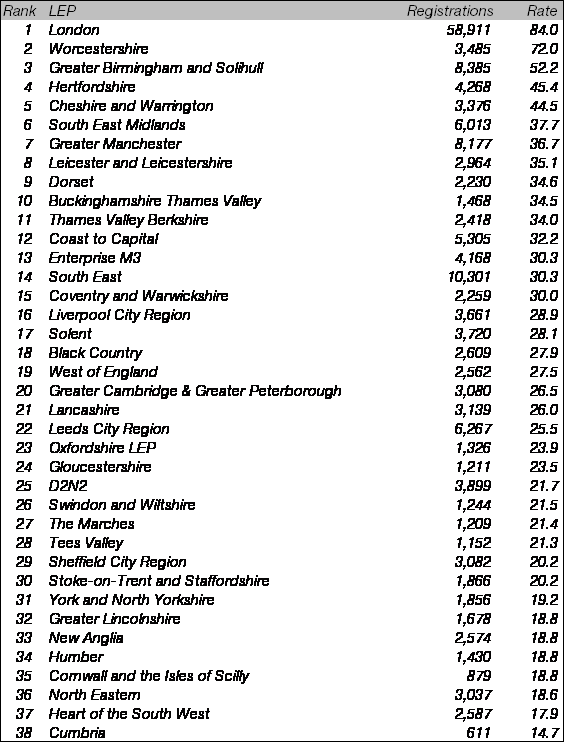
Sources: Companies House, 2019; MYPE, ONS, 2018