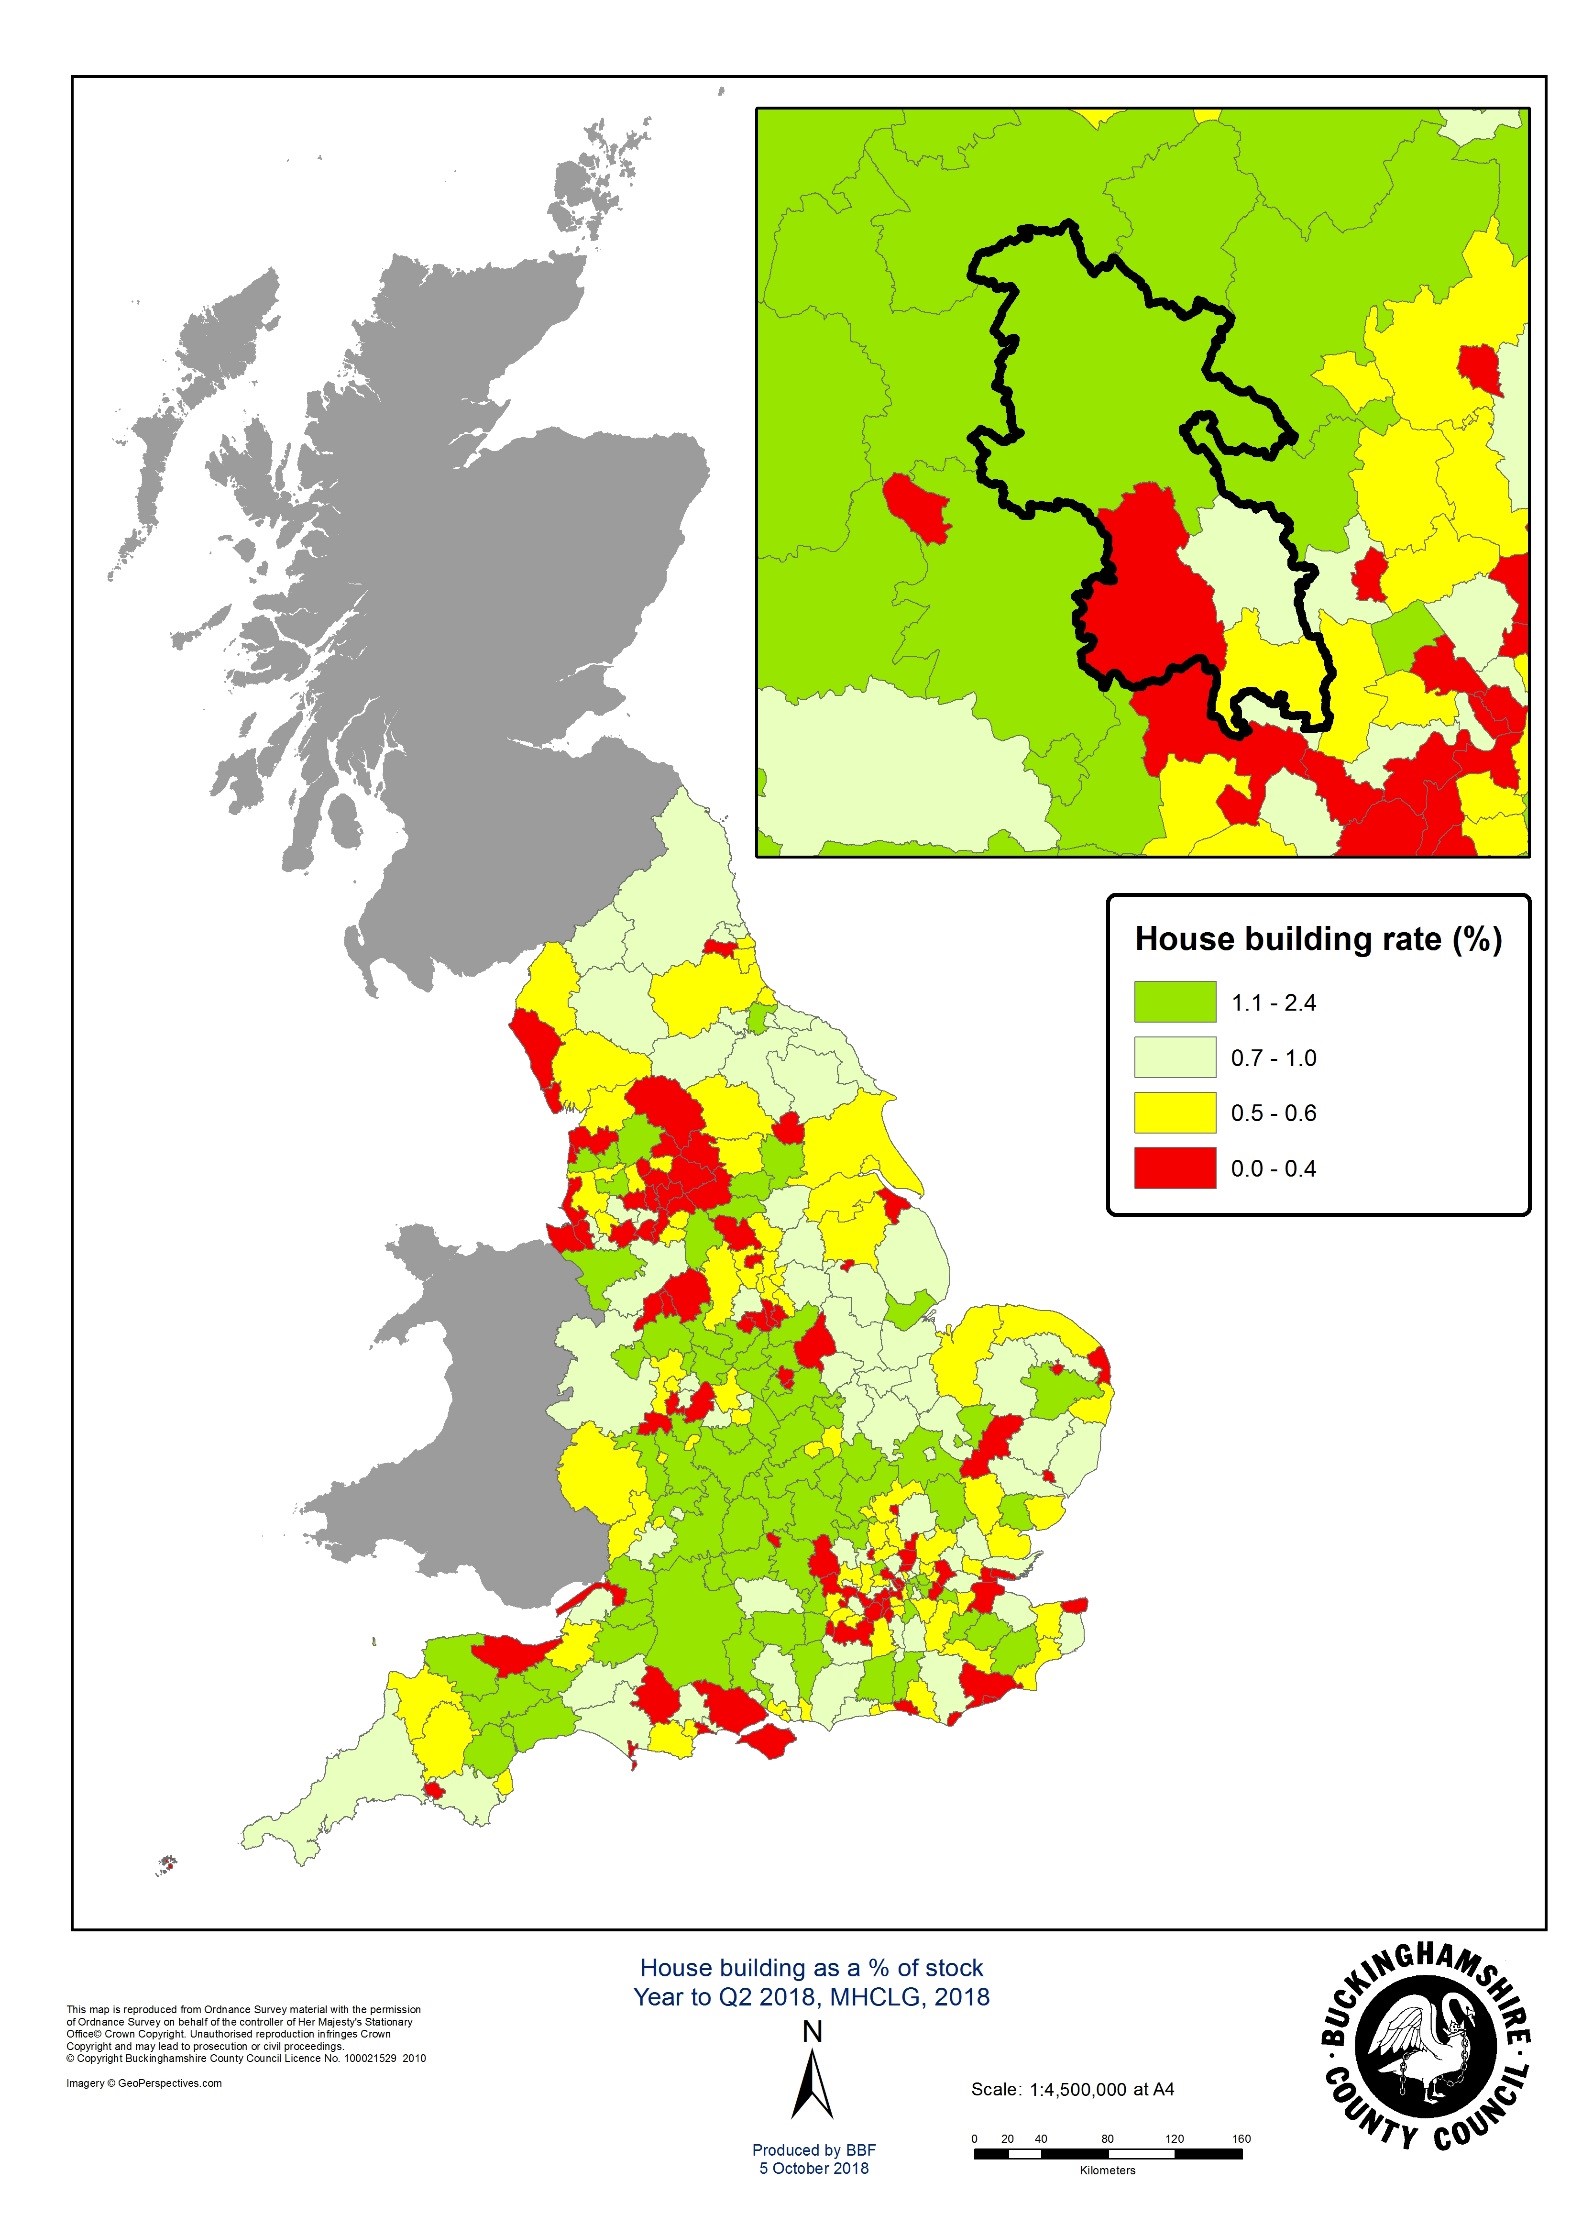
There were 1,920 new dwellings completed in Buckinghamshire in the year to the end of June 2018, representing 0.9 per cent of existing stock.
This was the 11th highest house building rate of the 27 county councils, ranking 9th among England’s 38 Local Enterprise Partnerships (LEPs). This was the 3rd highest four quarter total on record and well above the annual average of 1,549 completions recorded between 2006 and 2017.
While starts across England fell back to their lowest level since the end of 2016, they rose to a record high of 2,140 in Buckinghamshire, representing 1.0 per cent of stock, bettering the national rate of growth to rank 5th and 4th respectively among county council areas and LEPs. Since the pre-recession peak at the end of 2007, starts in Buckinghamshire have risen by 15.0 per cent, while falling 15.1 per cent across England.
Aylesbury Vale has had the 20th highest house building rate of all 326 local authorities in England in the last year, completing 1,240 new homes or 1.6 per cent of stock, and starting 1,450 (1.8 per cent) to rank 8th. The 240 new homes completed in Chiltern was the highest since 2013, while South Bucks and Wycombe saw fewer new homes completed in any four quarters since 2016.
In 2017, 64.6 per cent of Buckinghamshire’s new build housing growth was located in Aylesbury Vale, rising to 67.8 per cents of starts. Buckinghamshire is among the 21 LEPs and 13 county council areas where completions in the last year outnumbered starts.
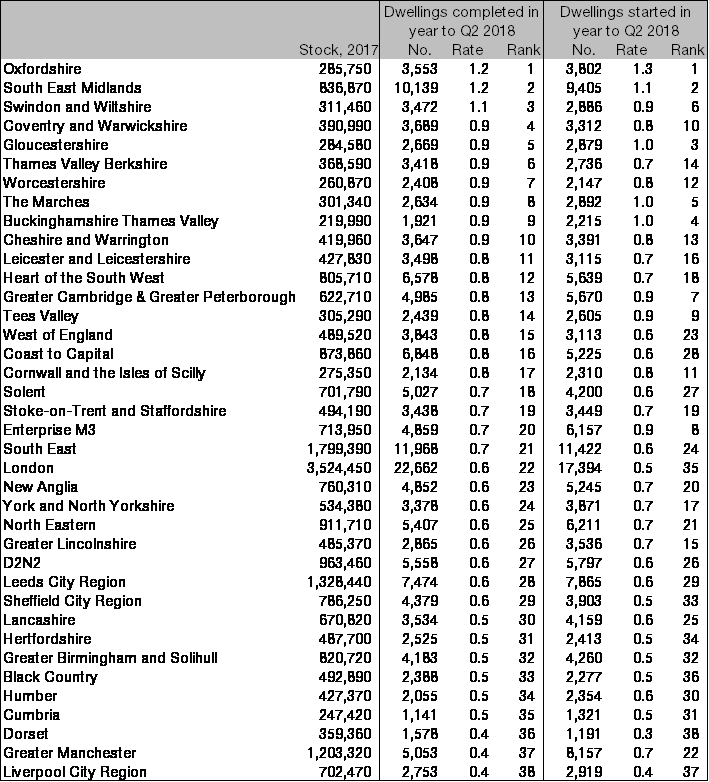
Table 1: Dwellings completed and started in the year to Q2 2018
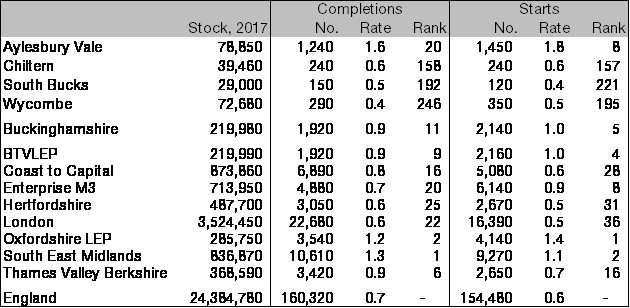
Source: MHCLG, 2018 (live tables 100 & 253a)
At the national level, completions rose 4.9 per cent compared to the previous year, reaching 160,470 despite completions in the quarter falling 23.5 per cent compared to the previous quarter and 7.1 per cent compared to the first quarter of 2017.
If national house building matched Buckinghamshire’s rate, 209,037 new homes would have been built in the last year, equating to more than a million over a Parliament. If England had matched Aylesbury Vale’s rate, 376,639 homes would have been built in the last year.
The raw data are available here: https://www.gov.uk/government/statistical-data-sets/live-tables-on-house-building
Table 2: Dwellings completed in years ending Q2 over time
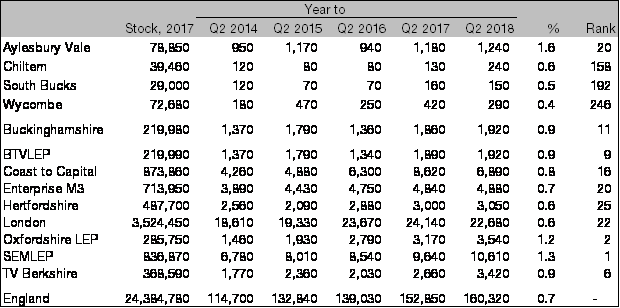
Source: MHCLG, 2018 (live tables 100 and 253a)
Table 3: Dwellings started in year ending Q1 over time
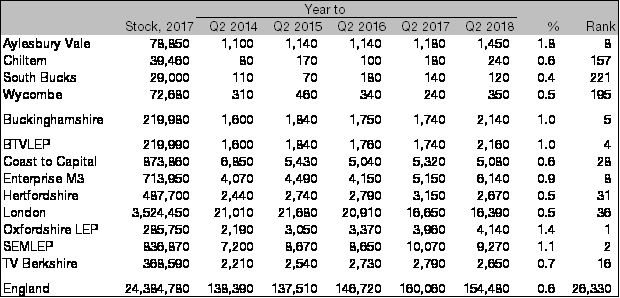
Source: MHCLG, 2018 (live tables 100 and 253a)
Table 4: Dwellings completed and started by LEP in year to Q1 2018
Source: MHCLG, 2018 (live tables 100 and 255a)